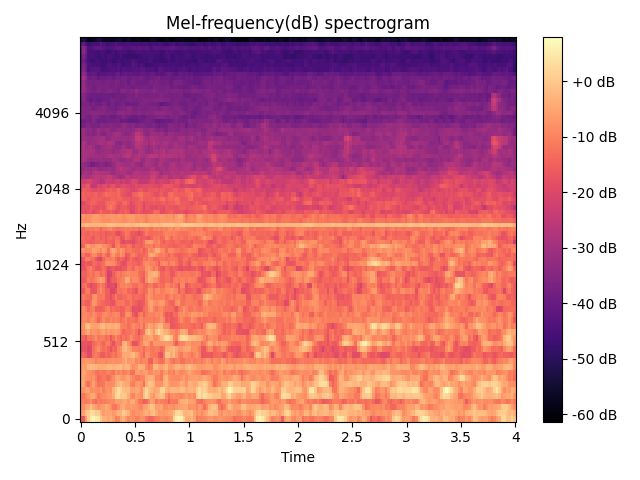
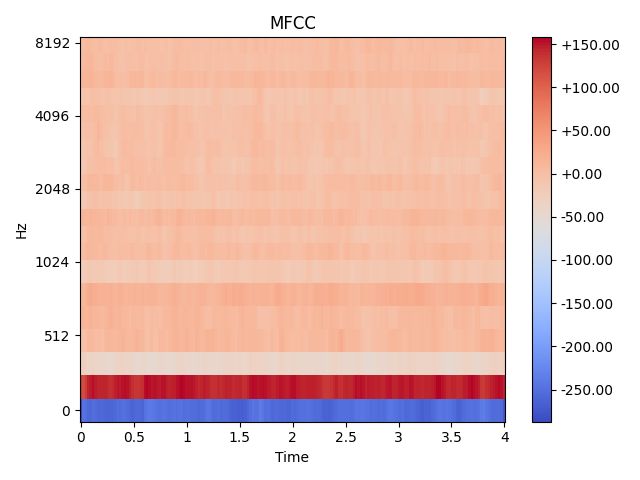
音频-特征提取:①幅度谱(短时傅里叶变换谱/STFT)、②梅尔频谱(mel-spectrogram)、③梅尔倒谱(MFCC)【在梅尔频谱上取对数,做DCT(离散余弦变换)变换,得梅尔倒谱】
原始信号
从音频文件中读取出来的原始语音信号通常称为raw waveform,是一个一维数组,长度是由音频长度和采样率决定,比如采样率Fs为16KHz,表示一秒钟内采样16000个点,这个时候如果音频长度是10秒,那么raw waveform中就有160000个值,值的大小通常表示的是振幅。
一、幅度谱(spectrogram)/ STFT
声音信号是一维信号,直观上只能看到时域信息,不能看到频域信息。
通过傅里叶变换(FT)可以变换到频域,但是丢失了时域信息,无法看到时频关系。为了解决这个问题,产生了很多方法,短时傅里叶变换,小波等都是很常用的时频分析方法。
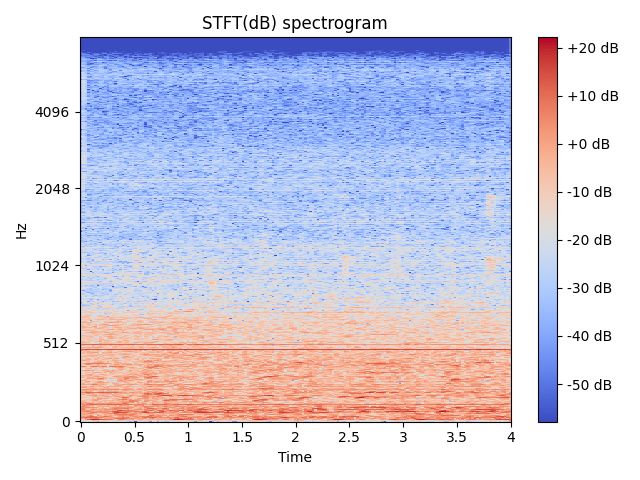
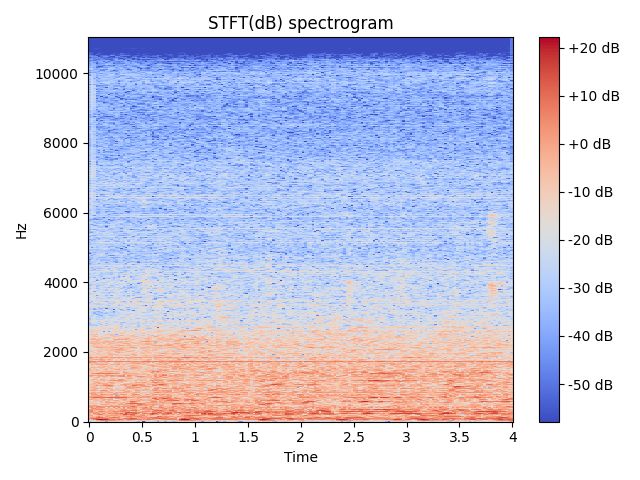
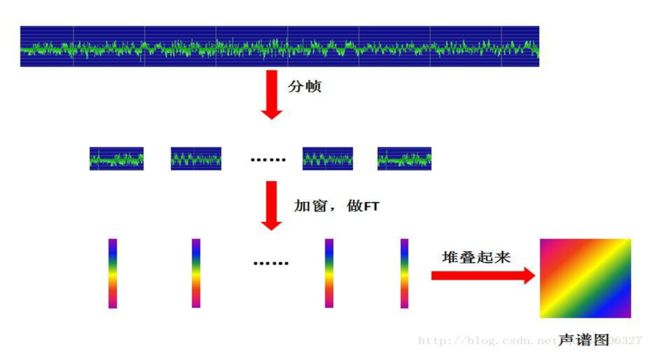
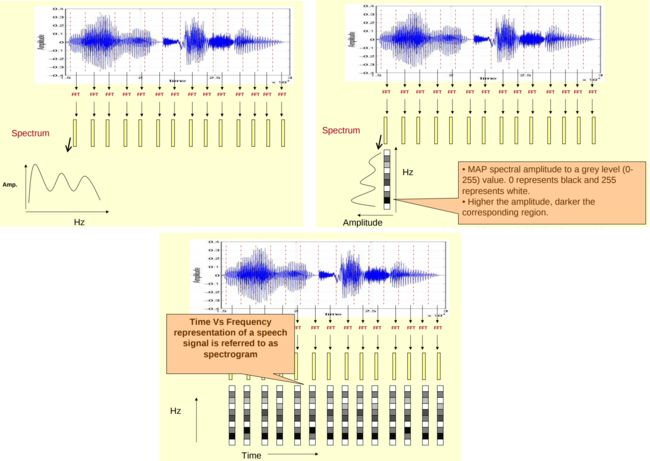
短时傅里叶变换(STFT),就是对短时的信号做傅里叶变换。原理如下:对一段长语音信号,分帧、加窗,再对每一帧做傅里叶变换,之后把每一帧的结果沿时间维度堆叠,得到一张图(类似于二维信号),这张图就是声谱图。
librosa.stft(y, *, n_fft=2048, hop_length=None,
				   win_length=None, window='hann', center=True, dtype=None, pad_mode='constant')
def stft(
    y, # 音频时间序列
    *,
    n_fft=2048,
    hop_length=None,
    win_length=None,
    window="hann",
    center=True,
    dtype=None,
    pad_mode="constant",
)
参数:
y:音频时间序列
n_fft:FFT窗口大小,n_fft=hop_length+overlapping
hop_length:帧移。
spectrum = np.abs(librosa.stft(frame, n_fft=self.nfft)),未指定hop_length时,则默认win_length / 4
spectrum = np.abs(librosa.stft(frame, n_fft=self.nfft, hop_length=len(frame)))时,如果帧移长度小于傅里叶变换点数,librosa.stft输出为hop_length+1
spectrum = np.abs(librosa.stft(frame, n_fft=self.nfft, hop_length=self.nfft))时,无论win_length设置为帧长还是nfft,librosa.stft输出都只有一帧。
最后得出结论librosa.stft的输出帧数为speech_length // hop_length + 1
win_length:每一帧音频都由window()加窗。窗长win_length,然后用零填充以匹配n_fft。
默认win_length=n_fft。
window:字符串,元组,数字,函数 shape =(n_fft, )
窗口(字符串,元组或数字)
窗函数,例如scipy.signal.hanning
长度为n_fft的向量或数组
center:bool
如果为True,则填充信号y,以使帧 D [:, t]以y [t * hop_length]为中心
如果为False,则D [:, t]从y [t * hop_length]开始
dtype:D的复数值类型。默认值为64-bit complex复数
pad_mode:如果center = True,则在信号的边缘使用填充模式。默认情况下,STFT使用reflection padding
返回:一个复数矩阵使得D(f,t) STFT矩阵 shape =(1 + nfft/2,t)其中:
n_fft/2是因为实数FFT信号具有对称性,我们只需要去一般的数据分析即可,全部返回有数据冗余。
n_frames: n_frames = (speech_len) // hop_len + 1。具体可以画图,信号处理之前首先需要padding, padding之后分帧,画图可以看到,真正与帧数有关系的,是hop_len。
参数详解:
- y:时间序列,通常是音频信号,表示为浮点值的一维 numpy.ndarray。 y[t]对应样本在t处的波形幅度; 幅度通常是作为最初拾取音频的麦克风或接收器设备周围压力变化的函数来测量的。y.shape = (64000,) 表示在整个音频中仅在一个通道(单声道)上录制了 64000(total_number_of_samples) 样本;
- n_fft:FFT窗口大小, n_fft = hop_length + overlapping \text{n\_fft = hop\_length + overlapping} n_fft = hop_length + overlapping;
- win_length:每一帧音频都由window()加窗。窗长为win_length,然后用0进行padding来匹配n_fft;默认 win_length = n_fft \text{win\_length = n\_fft} win_length = n_fft;
- hop_length:帧移,如果不指定,则默认 hop_length = win_length / 4 \text{hop\_length = win\_length / 4} hop_length = win_length / 4;
- window:使用的窗函数名称;
- center:布尔值,默认为True;
- 如果为True,则填充信号y,以使帧D [:,t] \text{[:,t]} [:,t]以 y[t * hop_length] \text{y[t * hop\_length]} y[t * hop_length]为中心;
- 如果为False,帧D [:,t] \text{[:,t]} [:,t]以 y[t * hop_length] \text{y[t * hop\_length]} y[t * hop_length]为开始;
- dtype:D的复数值类型,默认值为64-bit的complex复数;
- pad_mode:如果 center = True,则在信号的边缘使用填充模型;默认情况下,STFT使用 constant padding‘’
1、STFT案例01
import librosa

y, sr = librosa.load("air_conditioner01.wav")  # y.shape = (88200,)  sr = 22050
print("y.shape = {0}; y = {1}".format(y.shape, y))
print("sr = {0}".format(sr))

n_fft = 2048
win_length = n_fft  # 默认
hop_length = win_length // 4  # 默认

D = librosa.stft(y=y, n_fft=n_fft, win_length=win_length, hop_length=hop_length, window='hann', center=True, pad_mode='constant')
print("\nSTFT结果:D.shape = {0}; \nD = {1}".format(D.shape, D))
计算:
- 频率维度的频率组数: D . s h a p e [ 0 ] = n _ f f t 2 + 1 = 2048 2 + 1 = 1025 D.shape[0] = \cfrac{n\_fft}{2} + 1=\cfrac{2048}{2}+1=1025 D.shape[0]=2n_fft+1=22048+1=1025; 1025 1025 1025 是由FFT窗口大小决定的: 2048 / 2 + 1 2048/2 + 1 2048/2+1, 这个 1025 1025 1025 是声谱图的纵坐标,也就是他的频率被分成了1025份。
- 时间维度的帧数: D . s h a p e [ 1 ] = 样本总采样点数 hop_length + 1 = 88200 512 + 1 = 173 D.shape[1] = \cfrac{\text{样本总采样点数}}{\text{hop\_length}}+1=\cfrac{88200}{512}+1=173 D.shape[1]=hop_length样本总采样点数+1=51288200+1=173【默认: win_length = n_fft \text{win\_length = n\_fft} win_length = n_fft、 hop_length = win_length / 4 \text{hop\_length = win\_length / 4} hop_length = win_length / 4】; 173 173 173 是由总的信号长度和窗口大小和帧移决定的,也就是所谓的每一帧,即关于时间的讯息。
打印结果:
y.shape = (88200,); y = [-0.00429636 -0.01181004 -0.01559684 ... -0.02535474 -0.02254227 -0.01510671]

sr = 22050

STFT结果:D.shape = (1025, 173);
D = [[ 4.0991772e-02+0.0000000e+00j  7.6347418e-02+0.0000000e+00j
   1.0839665e-01+0.0000000e+00j ... -5.6880221e-02+0.0000000e+00j
  -4.0515706e-01+0.0000000e+00j -1.2604758e+00+0.0000000e+00j]
 [ 4.9349996e-03+2.2843832e-02j -6.5081336e-02-1.5483504e-03j
  -6.4895572e-03+8.5287131e-02j ...  8.6759105e-02+4.4598781e-02j
  -1.3626395e-01-3.5130250e-01j  1.2085854e+00-4.9212924e-01j]
 [-3.1803373e-02+6.2021937e-02j  1.8289314e-01-2.9990083e-02j
  -2.6830113e-01-2.0388773e-02j ...  2.5796932e-01-3.4968770e-01j
   8.2743064e-02-4.2531621e-01j -9.6776468e-01+1.2715183e+00j]
 ...
 [ 6.0332339e-04-2.8250517e-07j -3.0159805e-04+3.6464758e-07j
  -1.6187376e-07-1.8996661e-07j ... -1.5264601e-07-2.4162804e-07j
  -7.4535434e-04-8.3691225e-04j  2.4131173e-03+2.7090199e-03j]
 [-6.0317205e-04+8.0741266e-08j -4.6025047e-08+3.0144685e-04j
  -8.3143476e-08+1.5921461e-07j ... -1.0696644e-07+1.1993595e-07j
   4.5853498e-04-1.0226711e-03j -3.3102881e-03-1.4843964e-03j]
 [ 6.0308439e-04+0.0000000e+00j  3.0151531e-04+0.0000000e+00j
  -1.1964966e-07+0.0000000e+00j ...  2.1211932e-07+0.0000000e+00j
   1.1208834e-03+0.0000000e+00j  3.6279499e-03+0.0000000e+00j]]

Process finished with exit code 0
2、STFT案例02
import numpy as np
import librosa.display
import matplotlib.pyplot as plt

y, sr = librosa.load("air_conditioner01.wav")  # y.shape = (88200,)  sr = 22050
print("y.shape = {0}; \ny = {1}".format(y.shape, y))
print("\nsr = {0}".format(sr))

n_fft = 2048
win_length = n_fft  # 默认
hop_length = win_length // 4  # 默认

D = librosa.stft(y=y, n_fft=n_fft, win_length=win_length, hop_length=hop_length, window='hann', center=True, pad_mode='constant')
print("\nD.shape = {0}; \nD = {1}".format(D.shape, D))

D_abs = np.abs(D)  # 4.9349996e-03+2.2843832e-02j ----> 2.3370814e-02【a + bj ----> sqrt(a^2 + b^2)】
print("\nD_abs.shape = {0}; \nD_abs = {1}".format(D_abs.shape, D_abs))

D_pow = D_abs ** 2  # 4.9349996e-03+2.2843832e-02j ----> 5.4619490e-04【a + bj ----> a^2 + b^2】
print("\nD_pow.shape = {0}; \nD_pow = {1}".format(D_pow.shape, D_pow))

# 作图01
fig, ax = plt.subplots()
img = librosa.display.specshow(data=D_pow, x_axis='time', y_axis='mel', sr=sr, fmax=8000, ax=ax)
fig.colorbar(img, ax=ax, format='%+2.2f')
ax.set(title='STFT spectrogram')
fig.show()

D_dB = librosa.power_to_db(D_pow)  # 能量转换为分贝
print("\nD_dB.shape = {0}; \nD_dB = {1}".format(D_dB.shape, D_dB))

# 作图02
fig, ax = plt.subplots()
img = librosa.display.specshow(data=D_dB, x_axis='time', y_axis='mel', sr=sr, fmax=8000, ax=ax)
fig.colorbar(img, ax=ax, format='%+2.0f dB')
ax.set(title='STFT(dB) spectrogram')
fig.show()

# 作图03【y_axis='linear'】
fig, ax = plt.subplots()
img = librosa.display.specshow(data=D_dB, x_axis='time', y_axis='linear', sr=sr, fmax=8000, ax=ax)
fig.colorbar(img, ax=ax, format='%+2.0f dB')
ax.set(title='STFT(dB) spectrogram')
fig.show()
打印结果:
y.shape = (88200,);
y = [-0.00429636 -0.01181004 -0.01559684 ... -0.02535474 -0.02254227 -0.01510671]

sr = 22050

D.shape = (1025, 173);
D = [[ 4.0991772e-02+0.0000000e+00j  7.6347418e-02+0.0000000e+00j
   1.0839665e-01+0.0000000e+00j ... -5.6880221e-02+0.0000000e+00j
  -4.0515706e-01+0.0000000e+00j -1.2604758e+00+0.0000000e+00j]
 [ 4.9349996e-03+2.2843832e-02j -6.5081336e-02-1.5483504e-03j
  -6.4895572e-03+8.5287131e-02j ...  8.6759105e-02+4.4598781e-02j
  -1.3626395e-01-3.5130250e-01j  1.2085854e+00-4.9212924e-01j]
 [-3.1803373e-02+6.2021937e-02j  1.8289314e-01-2.9990083e-02j
  -2.6830113e-01-2.0388773e-02j ...  2.5796932e-01-3.4968770e-01j
   8.2743064e-02-4.2531621e-01j -9.6776468e-01+1.2715183e+00j]
 ...
 [ 6.0332339e-04-2.8250517e-07j -3.0159805e-04+3.6464758e-07j
  -1.6187376e-07-1.8996661e-07j ... -1.5264601e-07-2.4162804e-07j
  -7.4535434e-04-8.3691225e-04j  2.4131173e-03+2.7090199e-03j]
 [-6.0317205e-04+8.0741266e-08j -4.6025047e-08+3.0144685e-04j
  -8.3143476e-08+1.5921461e-07j ... -1.0696644e-07+1.1993595e-07j
   4.5853498e-04-1.0226711e-03j -3.3102881e-03-1.4843964e-03j]
 [ 6.0308439e-04+0.0000000e+00j  3.0151531e-04+0.0000000e+00j
  -1.1964966e-07+0.0000000e+00j ...  2.1211932e-07+0.0000000e+00j
   1.1208834e-03+0.0000000e+00j  3.6279499e-03+0.0000000e+00j]]

D_abs.shape = (1025, 173);
D_abs = [[4.0991772e-02 7.6347418e-02 1.0839665e-01 ... 5.6880221e-02
  4.0515706e-01 1.2604758e+00]
 [2.3370814e-02 6.5099753e-02 8.5533671e-02 ... 9.7550981e-02
  3.7680408e-01 1.3049406e+00]
 [6.9700614e-02 1.8533567e-01 2.6907471e-01 ... 4.3454534e-01
  4.3329009e-01 1.5979135e+00]
 ...
 [6.0332345e-04 3.0159828e-04 2.4958049e-07 ... 2.8580573e-07
  1.1207029e-03 3.6279366e-03]
 [6.0317205e-04 3.0144685e-04 1.7961662e-07 ... 1.6070609e-07
  1.1207634e-03 3.6278698e-03]
 [6.0308439e-04 3.0151531e-04 1.1964966e-07 ... 2.1211932e-07
  1.1208834e-03 3.6279499e-03]]

D_pow.shape = (1025, 173);
D_pow = [[1.6803254e-03 5.8289282e-03 1.1749834e-02 ... 3.2353594e-03
  1.6415225e-01 1.5887991e+00]
 [5.4619490e-04 4.2379778e-03 7.3160087e-03 ... 9.5161935e-03
  1.4198132e-01 1.7028699e+00]
 [4.8581758e-03 3.4349307e-02 7.2401196e-02 ... 1.8882965e-01
  1.8774031e-01 2.5533276e+00]
 ...
 [3.6399919e-07 9.0961521e-08 6.2290423e-14 ... 8.1684910e-14
  1.2559751e-06 1.3161924e-05]
 [3.6381653e-07 9.0870202e-08 3.2262130e-14 ... 2.5826448e-14
  1.2561105e-06 1.3161439e-05]
 [3.6371080e-07 9.0911477e-08 1.4316039e-14 ... 4.4994604e-14
  1.2563796e-06 1.3162020e-05]]

D_dB.shape = (1025, 173);
D_dB = [[-27.746067  -22.344112  -19.299683  ... -24.900776   -7.8475313
    2.01069  ]
 [-32.626526  -23.728413  -21.357258  ... -20.215368   -8.477688
    2.3118148]
 [-23.13527   -14.64082   -11.402542  ...  -7.2392983  -7.2644243
    4.071065 ]
 ...
 [-57.84667   -57.84667   -57.84667   ... -57.84667   -57.84667
  -48.806805 ]
 [-57.84667   -57.84667   -57.84667   ... -57.84667   -57.84667
  -48.80697  ]
 [-57.84667   -57.84667   -57.84667   ... -57.84667   -57.84667
  -48.80677  ]]

Process finished with exit code 0
3、STFT参数详解
"""Short-time Fourier transform (STFT).

The STFT represents a signal in the time-frequency domain by
computing discrete Fourier transforms (DFT) over short overlapping
windows.

This function returns a complex-valued matrix D such that

- ``np.abs(D[..., f, t])`` is the magnitude of frequency bin ``f``
  at frame ``t``, and

- ``np.angle(D[..., f, t])`` is the phase of frequency bin ``f``
  at frame ``t``.

The integers ``t`` and ``f`` can be converted to physical units by means
of the utility functions `frames_to_sample` and `fft_frequencies`.

Parameters
----------
y : np.ndarray [shape=(..., n)], real-valued
    input signal. Multi-channel is supported.

n_fft : int > 0 [scalar]
    length of the windowed signal after padding with zeros.
    The number of rows in the STFT matrix ``D`` is ``(1 + n_fft/2)``.
    The default value, ``n_fft=2048`` samples, corresponds to a physical
    duration of 93 milliseconds at a sample rate of 22050 Hz, i.e. the
    default sample rate in librosa. This value is well adapted for music
    signals. However, in speech processing, the recommended value is 512,
    corresponding to 23 milliseconds at a sample rate of 22050 Hz.
    In any case, we recommend setting ``n_fft`` to a power of two for
    optimizing the speed of the fast Fourier transform (FFT) algorithm.

hop_length : int > 0 [scalar]
    number of audio samples between adjacent STFT columns.

    Smaller values increase the number of columns in ``D`` without
    affecting the frequency resolution of the STFT.

    If unspecified, defaults to ``win_length // 4`` (see below).

win_length : int <= n_fft [scalar]
    Each frame of audio is windowed by ``window`` of length ``win_length``
    and then padded with zeros to match ``n_fft``.

    Smaller values improve the temporal resolution of the STFT (i.e. the
    ability to discriminate impulses that are closely spaced in time)
    at the expense of frequency resolution (i.e. the ability to discriminate
    pure tones that are closely spaced in frequency). This effect is known
    as the time-frequency localization trade-off and needs to be adjusted
    according to the properties of the input signal ``y``.

    If unspecified, defaults to ``win_length = n_fft``.

window : string, tuple, number, function, or np.ndarray [shape=(n_fft,)]
    Either:

    - a window specification (string, tuple, or number);
      see `scipy.signal.get_window`
    - a window function, such as `scipy.signal.windows.hann`
    - a vector or array of length ``n_fft``

    Defaults to a raised cosine window (`'hann'`), which is adequate for
    most applications in audio signal processing.

    .. see also:: `filters.get_window`

center : boolean
    If ``True``, the signal ``y`` is padded so that frame
    ``D[:, t]`` is centered at ``y[t * hop_length]``.

    If ``False``, then ``D[:, t]`` begins at ``y[t * hop_length]``.

    Defaults to ``True``,  which simplifies the alignment of ``D`` onto a
    time grid by means of `librosa.frames_to_samples`.
    Note, however, that ``center`` must be set to `False` when analyzing
    signals with `librosa.stream`.

    .. see also:: `librosa.stream`

dtype : np.dtype, optional
    Complex numeric type for ``D``.  Default is inferred to match the
    precision of the input signal.

pad_mode : string or function
    If ``center=True``, this argument is passed to `np.pad` for padding
    the edges of the signal ``y``. By default (``pad_mode="constant"``),
    ``y`` is padded on both sides with zeros.
    If ``center=False``,  this argument is ignored.

    .. see also:: `numpy.pad`

Returns
-------
D : np.ndarray [shape=(..., 1 + n_fft/2, n_frames), dtype=dtype]
    Complex-valued matrix of short-term Fourier transform
    coefficients.

See Also
--------
istft : Inverse STFT
reassigned_spectrogram : Time-frequency reassigned spectrogram

Notes
-----
This function caches at level 20.

Examples
--------
>>> y, sr = librosa.load(librosa.ex('trumpet'))
>>> S = np.abs(librosa.stft(y))
>>> S
array([[5.395e-03, 3.332e-03, ..., 9.862e-07, 1.201e-05],
       [3.244e-03, 2.690e-03, ..., 9.536e-07, 1.201e-05],
       ...,
       [7.523e-05, 3.722e-05, ..., 1.188e-04, 1.031e-03],
       [7.640e-05, 3.944e-05, ..., 5.180e-04, 1.346e-03]],
      dtype=float32)

Use left-aligned frames, instead of centered frames

>>> S_left = librosa.stft(y, center=False)

Use a shorter hop length

>>> D_short = librosa.stft(y, hop_length=64)

Display a spectrogram

>>> import matplotlib.pyplot as plt
>>> fig, ax = plt.subplots()
>>> img = librosa.display.specshow(librosa.amplitude_to_db(S,
...                                                        ref=np.max),
...                                y_axis='log', x_axis='time', ax=ax)
>>> ax.set_title('Power spectrogram')
>>> fig.colorbar(img, ax=ax, format="%+2.0f dB")
"""
二、梅尔频谱(melspectrogram)
人耳能听到的频率范围是20-20000HZ,但是人耳对HZ单位不是线性敏感,而是对低HZ敏感,对高HZ不敏感,将HZ频率转化为梅尔频率,则人耳对频率的感知度就变为线性。
例如如果我们适应了1000Hz的音调,如果把音调频率提高到2000Hz,我们的耳朵只能觉察到频率提高了一点点,根本察觉不到频率提高了一倍。
下图是HZ到Mel的映射关系图,由于二者为log关系,在频率较低时,Mel随HZ变化较快;当频率较高时,曲线斜率小,变化缓慢。
举例来说,,则人耳听起来两者的音调也如果两段语音的Mel频率相差两倍相差两倍。
使用python的librosa音频处理库可以轻松实现:
librosa.feature.melspectrogram(*, y=None, sr=22050, S=None, n_fft=2048,
								  hop_length=512, win_length=None, window='hann',
								  center=True, pad_mode='constant', power=2.0, **kwargs)
def melspectrogram(
    y=None,
    sr=22050,
    S=None,
    n_fft=2048,
    hop_length=512,
    win_length=None,
    window="hann",
    center=True,
    pad_mode="reflect",
    power=2.0,
    **kwargs,
):
- y:输入时域下的音频信号。shape= (n,);
- sr:采样频率;
- n_fft:FFT窗口个数,默认2048;
- hop_length:连续帧之间的采样数,默认512;
- window:使用加窗的类型,默认为汉宁窗;
- n_mels:返回结果的Mel bands数量(number of Mel bands to generate),默认128;
- return:梅尔频谱【shape=(…, n_mels, t)】;
1、梅尔频谱(melspectrogram)-案例01【直接从y计算】
import librosa.display
import matplotlib.pyplot as plt

y, sr = librosa.load("air_conditioner01.wav")  # y.shape = (88200,)  sr = 22050
print("y.shape = {0}; y = {1}".format(y.shape, y))
print("\nsr = {0}".format(sr))

n_fft = 2048
win_length = n_fft  # 默认
hop_length = win_length // 4  # 默认
n_mels = 80  # 默认 128

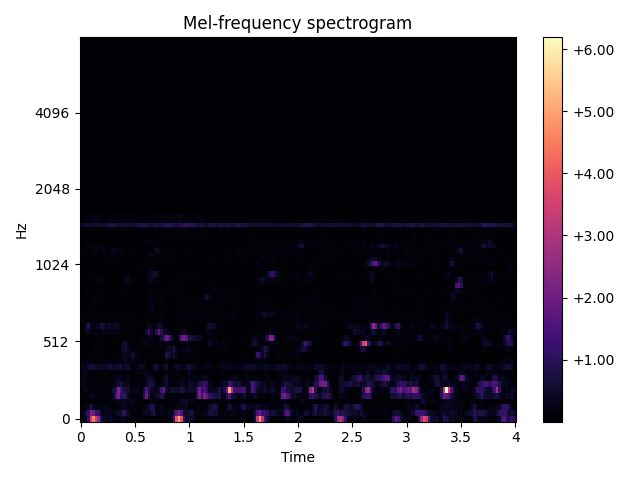
S = librosa.feature.melspectrogram(y=y, sr=sr, n_fft=n_fft, win_length=win_length, hop_length=hop_length, n_mels=n_mels)
print("\nMel频谱--结果:S.shape = {0}; \nS = {1}".format(S.shape, S))

# 作图01
fig, ax = plt.subplots()
img = librosa.display.specshow(S, x_axis='time', y_axis='mel', sr=sr, fmax=8000, ax=ax)
fig.colorbar(img, ax=ax, format='%+2.2f')
ax.set(title='Mel-frequency spectrogram')
fig.show()

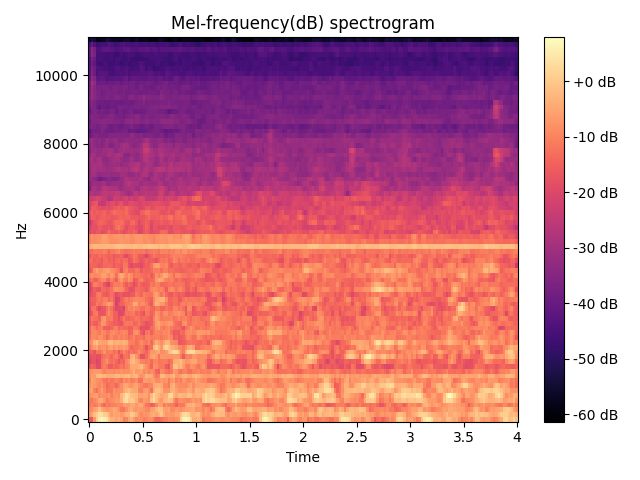
S_dB = librosa.power_to_db(S=S)
print("\nMel频谱-dB能量谱---结果:S_dB.shape = {0}; \nS_dB = {1}".format(S_dB.shape, S_dB))

# 作图02
fig, ax = plt.subplots()
img = librosa.display.specshow(S_dB, x_axis='time', y_axis='mel', sr=sr, fmax=8000, ax=ax)
fig.colorbar(img, ax=ax, format='%+2.0f dB')
ax.set(title='Mel-frequency(dB) spectrogram')
fig.show()

# 作图03
fig, ax = plt.subplots()
img = librosa.display.specshow(S_dB, x_axis='time', y_axis='linear', sr=sr, fmax=8000, ax=ax)
fig.colorbar(img, ax=ax, format='%+2.0f dB')
ax.set(title='Mel-frequency(dB) spectrogram')
fig.show()
打印结果:
y.shape = (88200,); y = [-0.00429636 -0.01181004 -0.01559684 ... -0.02535474 -0.02254227 -0.01510671]

sr = 22050

结果:S.shape = (80, 173);
S = [[2.1666234e-02 2.1649336e-02 1.9549519e-01 ... 7.8533143e-01  1.4178720e+00 7.7648085e-01]
 [1.6606098e-01 2.8194109e-01 7.3984677e-01 ... 5.2415431e-01  6.8600404e-01 4.3208513e-01]
 [1.0179499e-01 1.3825276e-01 2.5464761e-01 ... 6.1250693e-01  2.6014277e-01 1.3389401e-01]
 ...
 [6.9146539e-05 3.5622125e-04 1.7929733e-04 ... 4.7781770e-05  4.5372890e-05 3.5324701e-05]
 [3.0970994e-05 8.2059370e-05 3.9507086e-05 ... 2.9160121e-05  2.3678922e-05 1.5615517e-05]
 [2.1788853e-06 5.2237228e-06 3.3358933e-06 ... 1.7063500e-06  2.1911462e-06 2.4011656e-06]]

Process finished with exit code 0
2、梅尔频谱(melspectrogram)-案例02【从STFT的结果进一步计算】
import numpy as np
import librosa.display
import matplotlib.pyplot as plt

y, sr = librosa.load("air_conditioner01.wav")  # y.shape = (88200,)  sr = 22050
print("y.shape = {0}; y = {1}".format(y.shape, y))
print("\nsr = {0}".format(sr))

n_fft = 2048
win_length = n_fft  # 默认
hop_length = win_length // 4  # 默认
n_mels = 80  # 默认 128

D = librosa.stft(y=y, n_fft=n_fft, win_length=win_length, hop_length=hop_length, window='hann', center=True, pad_mode='constant')
print("\nSTFT结果:D.shape = {0}; \nD = {1}".format(D.shape, D))

D_abs = np.abs(D)  # 4.9349996e-03+2.2843832e-02j ----> 2.3370814e-02【a + bj ----> sqrt(a^2 + b^2)】
print("\nD_abs.shape = {0}; \nD_abs = {1}".format(D_abs.shape, D_abs))

D_pow = D_abs ** 2  # 4.9349996e-03+2.2843832e-02j ----> 5.4619490e-04【a + bj ----> a^2 + b^2】
print("\nD_pow.shape = {0}; \nD_pow = {1}".format(D_pow.shape, D_pow))

S = librosa.feature.melspectrogram(S=D_pow, sr=sr, n_mels=n_mels)
print("\nMel频谱--结果:S.shape = {0}; \nS = {1}".format(S.shape, S))

# 作图01
fig, ax = plt.subplots()
img = librosa.display.specshow(S, x_axis='time', y_axis='mel', sr=sr, fmax=8000, ax=ax)
fig.colorbar(img, ax=ax, format='%+2.2f')
ax.set(title='Mel-frequency spectrogram')
fig.show()

S_dB = librosa.power_to_db(S=S)
print("\nMel频谱-能量谱---结果:S_dB.shape = {0}; \nS_dB = {1}".format(S_dB.shape, S_dB))

# 作图02
fig, ax = plt.subplots()
img = librosa.display.specshow(S_dB, x_axis='time', y_axis='mel', sr=sr, fmax=8000, ax=ax)
fig.colorbar(img, ax=ax, format='%+2.0f dB')
ax.set(title='Mel-frequency(dB) spectrogram')
fig.show()

# 作图03
fig, ax = plt.subplots()
img = librosa.display.specshow(S_dB, x_axis='time', y_axis='linear', sr=sr, fmax=8000, ax=ax)
fig.colorbar(img, ax=ax, format='%+2.0f dB')
ax.set(title='Mel-frequency(dB) spectrogram')
fig.show()
打印结果:
y.shape = (88200,); y = [-0.00429636 -0.01181004 -0.01559684 ... -0.02535474 -0.02254227 -0.01510671]

sr = 22050

STFT结果:D.shape = (1025, 173);
D = [[ 4.0991772e-02+0.0000000e+00j  7.6347418e-02+0.0000000e+00j
   1.0839665e-01+0.0000000e+00j ... -5.6880221e-02+0.0000000e+00j
  -4.0515706e-01+0.0000000e+00j -1.2604758e+00+0.0000000e+00j]
 [ 4.9349996e-03+2.2843832e-02j -6.5081336e-02-1.5483504e-03j
  -6.4895572e-03+8.5287131e-02j ...  8.6759105e-02+4.4598781e-02j
  -1.3626395e-01-3.5130250e-01j  1.2085854e+00-4.9212924e-01j]
 [-3.1803373e-02+6.2021937e-02j  1.8289314e-01-2.9990083e-02j
  -2.6830113e-01-2.0388773e-02j ...  2.5796932e-01-3.4968770e-01j
   8.2743064e-02-4.2531621e-01j -9.6776468e-01+1.2715183e+00j]
 ...
 [ 6.0332339e-04-2.8250517e-07j -3.0159805e-04+3.6464758e-07j
  -1.6187376e-07-1.8996661e-07j ... -1.5264601e-07-2.4162804e-07j
  -7.4535434e-04-8.3691225e-04j  2.4131173e-03+2.7090199e-03j]
 [-6.0317205e-04+8.0741266e-08j -4.6025047e-08+3.0144685e-04j
  -8.3143476e-08+1.5921461e-07j ... -1.0696644e-07+1.1993595e-07j
   4.5853498e-04-1.0226711e-03j -3.3102881e-03-1.4843964e-03j]
 [ 6.0308439e-04+0.0000000e+00j  3.0151531e-04+0.0000000e+00j
  -1.1964966e-07+0.0000000e+00j ...  2.1211932e-07+0.0000000e+00j
   1.1208834e-03+0.0000000e+00j  3.6279499e-03+0.0000000e+00j]]

D_abs.shape = (1025, 173);
D_abs = [[4.0991772e-02 7.6347418e-02 1.0839665e-01 ... 5.6880221e-02
  4.0515706e-01 1.2604758e+00]
 [2.3370814e-02 6.5099753e-02 8.5533671e-02 ... 9.7550981e-02
  3.7680408e-01 1.3049406e+00]
 [6.9700614e-02 1.8533567e-01 2.6907471e-01 ... 4.3454534e-01
  4.3329009e-01 1.5979135e+00]
 ...
 [6.0332345e-04 3.0159828e-04 2.4958049e-07 ... 2.8580573e-07
  1.1207029e-03 3.6279366e-03]
 [6.0317205e-04 3.0144685e-04 1.7961662e-07 ... 1.6070609e-07
  1.1207634e-03 3.6278698e-03]
 [6.0308439e-04 3.0151531e-04 1.1964966e-07 ... 2.1211932e-07
  1.1208834e-03 3.6279499e-03]]

D_pow.shape = (1025, 173);
D_pow = [[1.6803254e-03 5.8289282e-03 1.1749834e-02 ... 3.2353594e-03
  1.6415225e-01 1.5887991e+00]
 [5.4619490e-04 4.2379778e-03 7.3160087e-03 ... 9.5161935e-03
  1.4198132e-01 1.7028699e+00]
 [4.8581758e-03 3.4349307e-02 7.2401196e-02 ... 1.8882965e-01
  1.8774031e-01 2.5533276e+00]
 ...
 [3.6399919e-07 9.0961521e-08 6.2290423e-14 ... 8.1684910e-14
  1.2559751e-06 1.3161924e-05]
 [3.6381653e-07 9.0870202e-08 3.2262130e-14 ... 2.5826448e-14
  1.2561105e-06 1.3161439e-05]
 [3.6371080e-07 9.0911477e-08 1.4316039e-14 ... 4.4994604e-14
  1.2563796e-06 1.3162020e-05]]

Mel频谱--结果:S.shape = (80, 173);
S = [[2.1666234e-02 2.1649336e-02 1.9549519e-01 ... 7.8533143e-01
  1.4178720e+00 7.7648085e-01]
 [1.6606098e-01 2.8194109e-01 7.3984677e-01 ... 5.2415431e-01
  6.8600404e-01 4.3208513e-01]
 [1.0179499e-01 1.3825276e-01 2.5464761e-01 ... 6.1250693e-01
  2.6014277e-01 1.3389401e-01]
 ...
 [6.9146539e-05 3.5622125e-04 1.7929733e-04 ... 4.7781770e-05
  4.5372890e-05 3.5324701e-05]
 [3.0970994e-05 8.2059370e-05 3.9507086e-05 ... 2.9160121e-05
  2.3678922e-05 1.5615517e-05]
 [2.1788853e-06 5.2237228e-06 3.3358933e-06 ... 1.7063500e-06
  2.1911462e-06 2.4011656e-06]]

Mel频谱-能量谱---结果:S_dB.shape = (80, 173);
S_dB = [[-16.642166  -16.645554   -7.0886393 ...  -1.0494702   1.5163702
   -1.0986925]
 [ -7.797324   -5.4984164  -1.3085821 ...  -2.8054085  -1.6367333
   -3.644307 ]
 [ -9.922736   -8.593262   -5.9406037 ...  -2.12889    -5.8478827
   -8.7323885]
 ...
 [-41.602295  -34.4828    -37.46426   ... -43.20738   -43.432037
  -44.519215 ]
 [-45.090446  -40.85872   -44.03325   ... -45.352104  -46.25638
  -48.064438 ]
 [-56.617657  -52.8202    -54.76788   ... -57.67932   -56.593285
  -56.195778 ]]

Process finished with exit code 0
参数详解
"""Compute a mel-scaled spectrogram.

If a spectrogram input ``S`` is provided, then it is mapped directly onto
the mel basis by ``mel_f.dot(S)``.

If a time-series input ``y, sr`` is provided, then its magnitude spectrogram
``S`` is first computed, and then mapped onto the mel scale by
``mel_f.dot(S**power)``.

By default, ``power=2`` operates on a power spectrum.

Parameters
----------
y : np.ndarray [shape=(..., n)] or None
    audio time-series. Multi-channel is supported.

sr : number > 0 [scalar]
    sampling rate of ``y``

S : np.ndarray [shape=(..., d, t)]
    spectrogram

n_fft : int > 0 [scalar]
    length of the FFT window

hop_length : int > 0 [scalar]
    number of samples between successive frames.
    See `librosa.stft`

win_length : int <= n_fft [scalar]
    Each frame of audio is windowed by `window()`.
    The window will be of length `win_length` and then padded
    with zeros to match ``n_fft``.

    If unspecified, defaults to ``win_length = n_fft``.

window : string, tuple, number, function, or np.ndarray [shape=(n_fft,)]
    - a window specification (string, tuple, or number);
      see `scipy.signal.get_window`
    - a window function, such as `scipy.signal.windows.hann`
    - a vector or array of length ``n_fft``

    .. see also:: `librosa.filters.get_window`

center : boolean
    - If `True`, the signal ``y`` is padded so that frame
      ``t`` is centered at ``y[t * hop_length]``.
    - If `False`, then frame ``t`` begins at ``y[t * hop_length]``

pad_mode : string
    If ``center=True``, the padding mode to use at the edges of the signal.

    By default, STFT uses zero padding.

power : float > 0 [scalar]
    Exponent for the magnitude melspectrogram.
    e.g., 1 for energy, 2 for power, etc.

**kwargs : additional keyword arguments
    Mel filter bank parameters.

    See `librosa.filters.mel` for details.

Returns
-------
S : np.ndarray [shape=(..., n_mels, t)]
    Mel spectrogram

See Also
--------
librosa.filters.mel : Mel filter bank construction
librosa.stft : Short-time Fourier Transform

Examples
--------
>>> y, sr = librosa.load(librosa.ex('trumpet'))
>>> librosa.feature.melspectrogram(y=y, sr=sr)
array([[3.837e-06, 1.451e-06, ..., 8.352e-14, 1.296e-11],
       [2.213e-05, 7.866e-06, ..., 8.532e-14, 1.329e-11],
       ...,
       [1.115e-05, 5.192e-06, ..., 3.675e-08, 2.470e-08],
       [6.473e-07, 4.402e-07, ..., 1.794e-08, 2.908e-08]],
      dtype=float32)

Using a pre-computed power spectrogram would give the same result:

>>> D = np.abs(librosa.stft(y))**2
>>> S = librosa.feature.melspectrogram(S=D, sr=sr)

Display of mel-frequency spectrogram coefficients, with custom
arguments for mel filterbank construction (default is fmax=sr/2):

>>> # Passing through arguments to the Mel filters
>>> S = librosa.feature.melspectrogram(y=y, sr=sr, n_mels=128,
...                                     fmax=8000)

>>> import matplotlib.pyplot as plt
>>> fig, ax = plt.subplots()
>>> S_dB = librosa.power_to_db(S, ref=np.max)
>>> img = librosa.display.specshow(S_dB, x_axis='time',
...                          y_axis='mel', sr=sr,
...                          fmax=8000, ax=ax)
>>> fig.colorbar(img, ax=ax, format='%+2.0f dB')
>>> ax.set(title='Mel-frequency spectrogram')
"""
三、梅尔倒谱(MFCC)
MFCC的全部组成其实是由:
- N维MFCC参数:
- N 3 \cfrac{N}{3} 3N 维MFCC系数/coefficients
- N 3 \cfrac{N}{3} 3N 维一阶差分参数/first-order derivatives
- N 3 \cfrac{N}{3} 3N 维二阶差分参数/second-order derivatives
- 帧能量(此项可根据需求替换)
librosa.feature.mfcc(*, y=None, sr=22050, S=None, n_mfcc=20, dct_type=2, norm='ortho', lifter=0, **kwargs)
def mfcc(
    y=None,
    sr=22050,
    S=None,
    n_mfcc=20,
    dct_type=2,
    norm="ortho",
    lifter=0,
    **kwargs
):
- y:输入时域下的音频信号
- sr:采样频率
- n_mfcc:返回mfcc特征的数量
- dct_type:DCT(离散余弦变换)的类型,默认为2
- return:返回mfcc特征序列
这里主要设置sr和n_mfcc(你要提取特征的个数)
1、MFCC案例01【直接从y计算】
import librosa.display
import matplotlib.pyplot as plt

y, sr = librosa.load("air_conditioner01.wav")  # y.shape = (88200,)  sr = 22050
print("y.shape = {0}; y = {1}".format(y.shape, y))
print("\nsr = {0}".format(sr))

sr = 22050  # 默认 22050
n_mfcc = 20  # 默认 20
dct_type = 2  # 默认 2
norm = "ortho"  # 默认 "ortho"
lifter = 0  # 默认 0

mfccs = librosa.feature.mfcc(y=y, sr=sr, n_mfcc=n_mfcc, dct_type=dct_type, norm=norm, lifter=lifter)
print("\nMFCC--结果:mfccs.shape = {0}; \nmfccs = {1}".format(mfccs.shape, mfccs))

# 作图
fig, ax = plt.subplots()
img = librosa.display.specshow(mfccs, x_axis='time', y_axis='mel', sr=sr, fmax=8000, ax=ax)
fig.colorbar(img, ax=ax, format='%+2.2f')
ax.set(title='MFCC')
fig.show()
打印结果:
y.shape = (88200,); y = [-0.00429636 -0.01181004 -0.01559684 ... -0.02535474 -0.02254227 -0.01510671]

sr = 22050

MFCC--结果:mfccs.shape = (20, 173);
mfccs = [[-287.29108   -247.5219    -249.65224   ... -253.60095   -254.32365  -275.92908  ]
 [ 129.54532    118.740906   129.125     ...  154.39165    151.97177   145.18109  ]
 [ -30.826519   -26.77267    -32.930305  ...  -33.37476    -32.383087   -30.955482 ]
 ...
 [   9.547321    12.869612    13.215841  ...    7.2535534    7.9752393     6.778652 ]
 [   4.4144416    4.8549047    7.463866  ...    3.3326685    3.2872963     5.157634 ]
 [   2.9182916    4.505571     5.7218165 ...    4.5183744    1.9608486    -1.0470729]]

Process finished with exit code 0
2、MFCC案例02【从melspectrogram的结果进一步计算】
import numpy as np
import librosa.display
import matplotlib.pyplot as plt

y, sr = librosa.load("air_conditioner01.wav")  # y.shape = (88200,)  sr = 22050
print("y.shape = {0}; y = {1}".format(y.shape, y))
print("\nsr = {0}".format(sr))

n_fft = 2048
win_length = n_fft  # 默认
hop_length = win_length // 4  # 默认
n_mels = 80  # 默认 128

S = librosa.feature.melspectrogram(y=y, sr=sr, n_fft=n_fft, win_length=win_length, hop_length=hop_length, n_mels=n_mels)
print("\nMel频谱--结果:S.shape = {0}; \nS = {1}".format(S.shape, S))

S_dB = librosa.power_to_db(S=S, ref=np.max)
print("\nMel频谱-dB能量谱---结果:S_dB.shape = {0}; \nS_dB = {1}".format(S_dB.shape, S_dB))

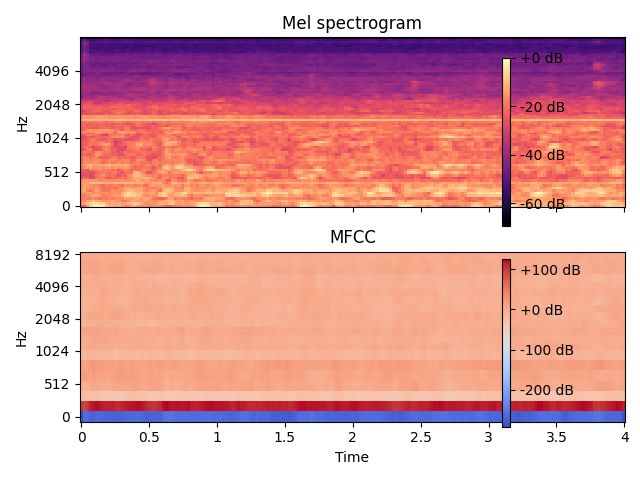
mfccs = librosa.feature.mfcc(S=S_dB)
print("\nMFCC---结果:mfccs.shape = {0}; \nmfccs = {1}".format(mfccs.shape, mfccs))

# 作图
fig, ax = plt.subplots(nrows=2, sharex=True)

img = librosa.display.specshow(S_dB, x_axis='time', y_axis='mel', fmax=8000, ax=ax[0])
fig.colorbar(img, ax=[ax[0]], format='%+2.0f dB')
ax[0].set(title='Mel spectrogram')
ax[0].label_outer()

img = librosa.display.specshow(mfccs, x_axis='time', y_axis='mel', fmax=8000, ax=ax[1])
fig.colorbar(img, ax=[ax[1]], format='%+2.0f dB')
ax[1].set(title='MFCC')
ax[1].label_outer()

fig.show()
3、参数详解
"""Mel-frequency cepstral coefficients (MFCCs)

.. warning:: If multi-channel audio input ``y`` is provided, the MFCC
    calculation will depend on the peak loudness (in decibels) across
    all channels.  The result may differ from independent MFCC calculation
    of each channel.

Parameters
----------
y : np.ndarray [shape=(..., n,)] or None
    audio time series. Multi-channel is supported..

sr : number > 0 [scalar]
    sampling rate of ``y``

S : np.ndarray [shape=(..., d, t)] or None
    log-power Mel spectrogram

n_mfcc : int > 0 [scalar]
    number of MFCCs to return

dct_type : {1, 2, 3}
    Discrete cosine transform (DCT) type.
    By default, DCT type-2 is used.

norm : None or 'ortho'
    If ``dct_type`` is `2 or 3`, setting ``norm='ortho'`` uses an ortho-normal
    DCT basis.

    Normalization is not supported for ``dct_type=1``.

lifter : number >= 0
    If ``lifter>0``, apply *liftering* (cepstral filtering) to the MFCCs::

        M[n, :] <- M[n, :] * (1 + sin(pi * (n + 1) / lifter) * lifter / 2)

    Setting ``lifter >= 2 * n_mfcc`` emphasizes the higher-order coefficients.
    As ``lifter`` increases, the coefficient weighting becomes approximately linear.

**kwargs : additional keyword arguments
    Arguments to `melspectrogram`, if operating
    on time series input

Returns
-------
M : np.ndarray [shape=(..., n_mfcc, t)]
    MFCC sequence

See Also
--------
melspectrogram
scipy.fftpack.dct

Examples
--------
Generate mfccs from a time series

>>> y, sr = librosa.load(librosa.ex('libri1'))
>>> librosa.feature.mfcc(y=y, sr=sr)
array([[-565.919, -564.288, ..., -426.484, -434.668],
       [  10.305,   12.509, ...,   88.43 ,   90.12 ],
       ...,
       [   2.807,    2.068, ...,   -6.725,   -5.159],
       [   2.822,    2.244, ...,   -6.198,   -6.177]], dtype=float32)

Using a different hop length and HTK-style Mel frequencies

>>> librosa.feature.mfcc(y=y, sr=sr, hop_length=1024, htk=True)
array([[-5.471e+02, -5.464e+02, ..., -4.446e+02, -4.200e+02],
       [ 1.361e+01,  1.402e+01, ...,  9.764e+01,  9.869e+01],
       ...,
       [ 4.097e-01, -2.029e+00, ..., -1.051e+01, -1.130e+01],
       [-1.119e-01, -1.688e+00, ..., -3.442e+00, -4.687e+00]],
      dtype=float32)

Use a pre-computed log-power Mel spectrogram

>>> S = librosa.feature.melspectrogram(y=y, sr=sr, n_mels=128,
...                                    fmax=8000)
>>> librosa.feature.mfcc(S=librosa.power_to_db(S))
array([[-559.974, -558.449, ..., -411.96 , -420.458],
       [  11.018,   13.046, ...,   76.972,   80.888],
       ...,
       [   2.713,    2.379, ...,    1.464,   -2.835],
       [   2.712,    2.619, ...,    2.209,    0.648]], dtype=float32)

Get more components

>>> mfccs = librosa.feature.mfcc(y=y, sr=sr, n_mfcc=40)

Visualize the MFCC series

>>> import matplotlib.pyplot as plt
>>> fig, ax = plt.subplots(nrows=2, sharex=True)
>>> img = librosa.display.specshow(librosa.power_to_db(S, ref=np.max),
...                                x_axis='time', y_axis='mel', fmax=8000,
...                                ax=ax[0])
>>> fig.colorbar(img, ax=[ax[0]])
>>> ax[0].set(title='Mel spectrogram')
>>> ax[0].label_outer()
>>> img = librosa.display.specshow(mfccs, x_axis='time', ax=ax[1])
>>> fig.colorbar(img, ax=[ax[1]])
>>> ax[1].set(title='MFCC')

Compare different DCT bases

>>> m_slaney = librosa.feature.mfcc(y=y, sr=sr, dct_type=2)
>>> m_htk = librosa.feature.mfcc(y=y, sr=sr, dct_type=3)
>>> fig, ax = plt.subplots(nrows=2, sharex=True, sharey=True)
>>> img1 = librosa.display.specshow(m_slaney, x_axis='time', ax=ax[0])
>>> ax[0].set(title='RASTAMAT / Auditory toolbox (dct_type=2)')
>>> fig.colorbar(img, ax=[ax[0]])
>>> img2 = librosa.display.specshow(m_htk, x_axis='time', ax=ax[1])
>>> ax[1].set(title='HTK-style (dct_type=3)')
>>> fig.colorbar(img2, ax=[ax[1]])
"""
四、梅尔频谱(melspectrogram) v.s. 梅尔倒谱(MFCC)
To get MFCC, compute the DCT on the mel-spectrogram. The mel-spectrogram is often log-scaled before.
MFCC is a very compressible representation, often using just 20 or 13 coefficients instead of 32-64 bands in Mel spectrogram.
The MFCC is a bit more decorrelarated, which can be beneficial with linear models like Gaussian Mixture Models.
With lots of data and strong classifiers like Convolutional Neural Networks, mel-spectrogram can often perform better.
梅尔频谱(melspectrogram)与 梅尔倒谱(MFCC)的区别:
- (melspectrogram)梅尔频谱的提取过程:输入语音信号->预加重->分针->加窗->FFT(傅里叶变换)->Mel滤波器-> 直接输出的一个结果
- (MFCC)梅尔倒谱的提取过程:输入语音信号->预加重->分针->加窗->FFT(傅里叶变换)->Mel滤波器->对数运算->DCT(离散预先变换)->MFCC
- 从MFCC的API可以看出来,MFCC是在梅尔频谱(melspectrogram)基础上得来的,即:在梅尔频谱上取对数,做DCT变换,就得到了梅尔倒谱。
# -- Mel spectrogram and MFCCs -- #
def mfcc(y=None, sr=22050, S=None, n_mfcc=20, **kwargs):
    if S is None:
        S = logamplitude(melspectrogram(y=y, sr=sr, **kwargs))

    return np.dot(filters.dct(n_mfcc, S.shape[0]), S)
给定原始的音频信号,通过melspectrogram()函数提取梅尔频谱,然后通过DCT离散余弦变换得到梅尔倒谱系数。(总之一句话,在梅尔频谱上取对数,做DCT变换,就得到了梅尔倒谱)
五、Mel滤波器
Mel滤波器对应了频率提高之后人耳会迟钝的客观规律:
- Mel滤波器在人声的信号处理上有着广泛的使用;
- 但是如果应用到非人声上,就会丢失很多高频信息;所以如果处理非人声,则一般不用梅尔频谱(melspectrogram)或梅尔倒谱(MFCC),而用STFT;
参考资料:
声谱图,梅尔语谱,倒谱,梅尔倒谱系数
【Day6】窗涵式,n_fft ,hop_length 到底什麽意思啊?
零基础入门语音识别: 一文详解MFCC特征(附python代码)
论文笔记:语音情感识别(四)语音特征之声谱图,log梅尔谱,MFCC,deltas
声谱图,梅尔谱图
librosa 语音库(二)STFT 的实现
梅尔频谱和梅尔倒谱的初次理解和使用
音频特征提取——常用音频特征
深度学习之语音识别-音频基础知识、声谱图(Spectrogram)
声谱图
STFT和声谱图,梅尔频谱(Mel Bank Features)与梅尔倒谱(MFCCs)
语谱图(四) Mel spectrogram 梅尔语谱图
librosa 语音库(三) librosa.feature. 中的 spectrogram 与 melspectrogram
librosa.feature.melspectrogram 的形状(Shape of librosa.feature.melspectrogram)
librosa.feature.melspectrogram()
【librosa】音频特征提取
信号处理基础——傅里叶变换与短时傅里叶变换
语音信号加窗分帧是起什么作用
声学特征(二) MFCC特征原理
MFCC
librosa–学习笔记(2)(频谱特性 Spectral representations)


