ELK企业级日志分析平台(二)
文章目录
- 一、kibana数据可视化
-
- 1.部署
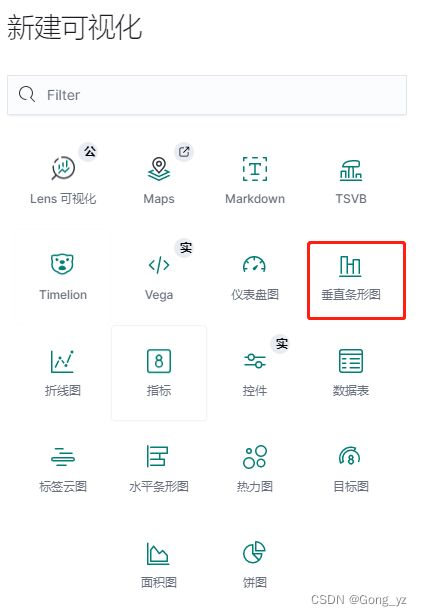
- 2.定制数据可视化
-
- (1)网站访问量
- (2)访问量排行榜
- (3)创建dashboard,大屏展示
- 二、ES集群监控
-
- 1.启用xpack认证
- 2.metricbeat监控
- 3.filebeat日志采集
一、kibana数据可视化
ELK中,E最核心,其余均可替代
1.部署
新建虚拟机server5,部署kibana
[root@server5 ~]# rpm -ivh kibana-7.6.1-x86_64.rpm

[root@server5 ~]# cd /etc/kibana/
[root@server5 kibana]# vim kibana.yml

server.host: "0.0.0.0"                    ##所有端口

elasticsearch.hosts: ["http://192.168.56.11:9200"]    ##elasticsearch主机

i18n.locale: "zh-CN"                       ##字体:中文

[root@server5 kibana]# systemctl  enable --now kibana

[root@server5 kibana]# netstat -antlp |grep :5601
tcp        0      0 192.168.56.15:5601     0.0.0.0:*               LISTEN      25385/node
访问web页面: http://192.168.56.15:5601
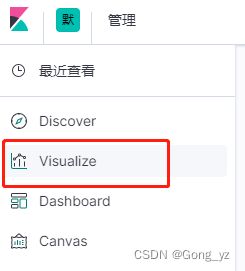
2.定制数据可视化
L监听文件的变更,格式化后,写入到ES中,最后通过kibana做数据可视化

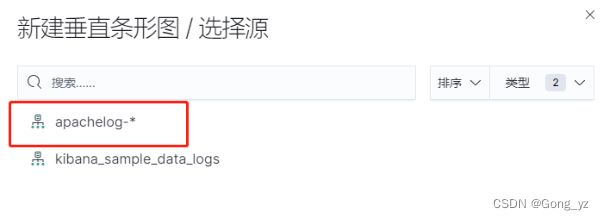
kibana可以直接连接ES


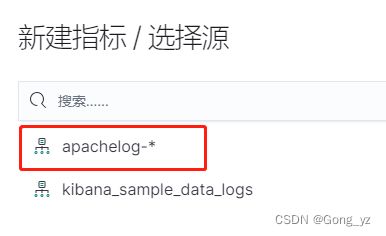
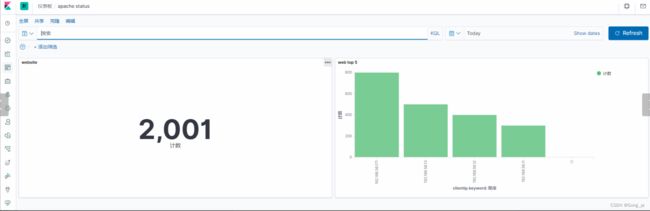
(1)网站访问量
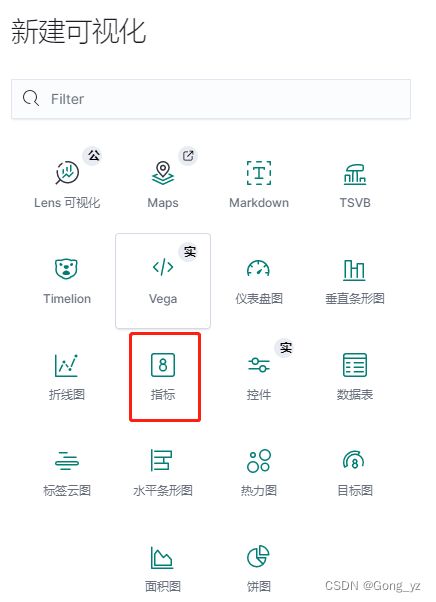

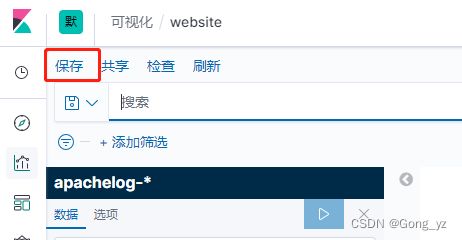
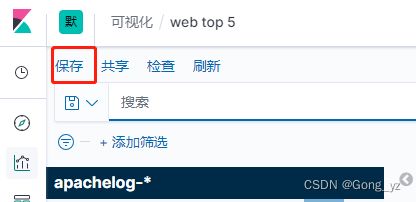
保存视图
(2)访问量排行榜
x轴填主机ip进行筛选

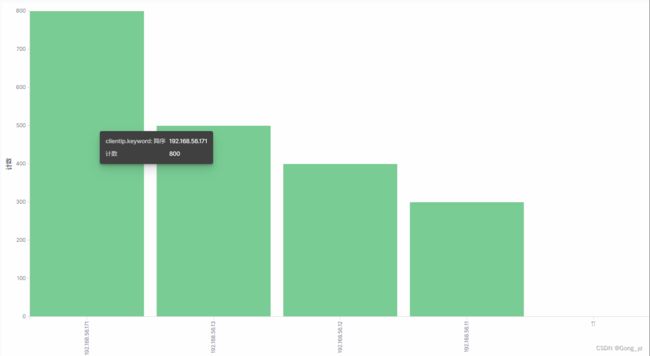
保存视图
(3)创建dashboard,大屏展示

把上面创建的两个可视化添加到仪表板中
二、ES集群监控
1.启用xpack认证
官网:https://www.elastic.co/guide/en/elasticsearch/reference/7.6/configuring-tls.html#node-certificates
在server1上生成证书
[root@server1 ~]# cd /usr/share/elasticsearch/
[root@server1 elasticsearch]# bin/elasticsearch-certutil ca      ##生成ca.p12
[root@server1 elasticsearch]# bin/elasticsearch-certutil cert --ca elastic-stack-ca.p12
[root@server1 elasticsearch]# cp elastic-certificates.p12 /etc/elasticsearch   ##
[root@server1 elasticsearch]# cd /etc/elasticsearch/
[root@server1 elasticsearch]# chown elasticsearch elastic-certificates.p12     ##该权限

[root@server1 elasticsearch]# vim elasticsearch.yml      ##加到最后即可;及的内容为官方文档得来
...
http.cors.allow-headers: Authorization,X-Requested-With,Content-Length,Content-Type    ##认证;交到Node处

xpack.security.enabled: true
xpack.security.transport.ssl.enabled: true
xpack.security.transport.ssl.verification_mode: certificate
xpack.security.transport.ssl.keystore.path: /etc/elasticsearch/elastic-certificates.p12
xpack.security.transport.ssl.truststore.path: /etc/elasticsearch/elastic-certificates.p12

[root@server1 elasticsearch]# systemctl  restart elasticsearch.service
拷贝证书到其它集群节点
[root@server1 elasticsearch]# scp elastic-certificates.p12 server2:/etc/elasticsearch/
[root@server1 elasticsearch]# scp elastic-certificates.p12 server3:/etc/elasticsearch/
server2配置
[root@server2 ~]# chown elasticsearch /etc/elasticsearch/elastic-certificates.p12
[root@server2 ~]# vim /etc/elasticsearch/elasticsearch.yml
...
xpack.security.enabled: true
xpack.security.transport.ssl.enabled: true
xpack.security.transport.ssl.verification_mode: certificate
xpack.security.transport.ssl.keystore.path: /etc/elasticsearch/elastic-certificates.p12
xpack.security.transport.ssl.truststore.path: /etc/elasticsearch/elastic-certificates.p12

[root@server2 ~]# systemctl  restart elasticsearch.service

server3配置
[root@server3 ~]# chown elasticsearch /etc/elasticsearch/elastic-certificates.p12
[root@server3 ~]# vim /etc/elasticsearch/elasticsearch.yml
...
xpack.security.enabled: true
xpack.security.transport.ssl.enabled: true
xpack.security.transport.ssl.verification_mode: certificate
xpack.security.transport.ssl.keystore.path: /etc/elasticsearch/elastic-certificates.p12
xpack.security.transport.ssl.truststore.path: /etc/elasticsearch/elastic-certificates.p12

[root@server3 ~]# systemctl  restart elasticsearch.service
等待所有集群节点重启成功后,设置认证账户密码
[root@server1 elasticsearch]# cd /usr/share/elasticsearch/
[root@server1 elasticsearch]# bin/elasticsearch-setup-passwords interactive
交互式输入密码

ES启用xpack之后,其它服务都需要配置认证
head插件在访问时,需要在url中输入用户和密码
[root@k8s1 ~]# cd elasticsearch-head-master/
[root@k8s1 elasticsearch-head-master]# npm run start &
访问web1:http://192.168.56.171:9100/?auth_user=elastic&auth_password=westos
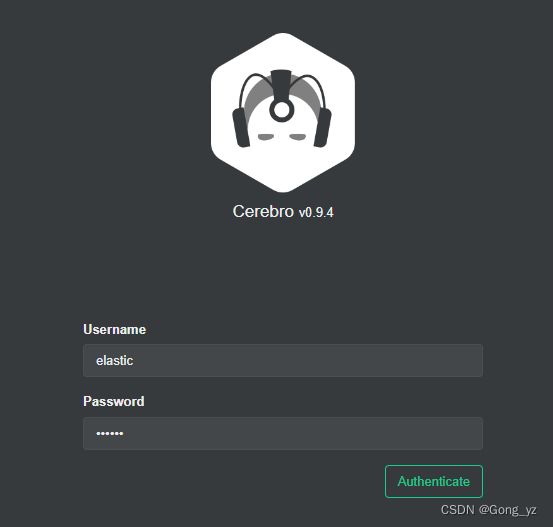
cerebro访问:
[root@k8s1 ~]# docker start cerebro ##启动容器
访问web2:http://192.168.56.171:9000/
并连接ES集群,弹出认证
logstash访问
[root@server4 ~]# vim /etc/logstash/conf.d/grok.conf
input {
        file {
                path => "/var/log/httpd/access_log"
                start_position => "beginning"
        }
}

filter {
        grok {
                match => { "message" => "%{HTTPD_COMBINEDLOG}" }
        }
}

output {
        stdout {}

        elasticsearch {
                hosts => "192.168.56.11:9200"
                index => "apachelog-%{+YYYY.MM.dd}"
                user => "elastic"                       ####用户
                password => "westos"                      ###密码
        }

}
查看是否启动成功:若失败会直接退出
[root@server4 conf.d]# /usr/share/logstash/bin/logstash -f /etc/logstash/conf.d/grok.conf
kibana访问
[root@server5 kibana]# vim kibana.yml
...
elasticsearch.username: "kibana"         ##用户认证选项,打开并修改密码
elasticsearch.password: "westos"

[root@server5 kibana]# systemctl  restart kibana.service
[root@server5 kibana]# netstat -antlp|grep :5601
tcp        1      0 0.0.0.0:5601            0.0.0.0:*               LISTEN      35945/node
访问web3:http://192.168.56.15:5601

2.metricbeat监控
官网:https://www.elastic.co/guide/en/elasticsearch/reference/7.6/configuring-metricbeat.html
首先使用内部检测,然后进入设置模式

选择启动metricbeat的节点,然后根据提示步骤操作
安装软件
[root@server1 ~]# rpm -ivh metricbeat-7.6.1-x86_64.rpm
[root@server1 ~]# cd /etc/metricbeat/modules.d
[root@server1 modules.d]# metricbeat modules enable elasticsearch-xpack
[root@server1 modules.d]# vim elasticsearch-xpack.yml ##监控谁
- module: elasticsearch
metricsets:
- ccr
- cluster_stats
- enrich
- index
- index_recovery
- index_summary
- ml_job
- node_stats
- shard
period: 10s
hosts: ["http://localhost:9200"] ##localhost=192.168.56.11
username: "remote_monitoring_user" ##认证的用户
password: "westos" ##密码
xpack.enabled: true
[root@server1 modules.d]# cd ..
[root@server1 metricbeat]# vim metricbeat.yml ##往哪里输出
...
output.elasticsearch: ##监控集群
hosts: ["http://192.168.56.11:9200"]
username: "elastic"
password: "westos"
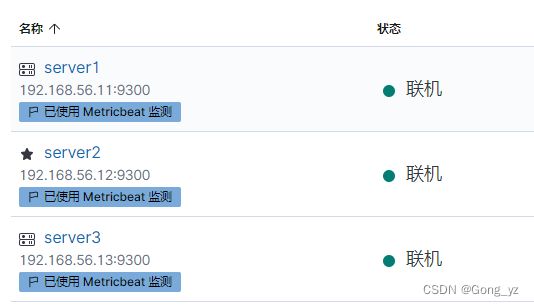
[root@server1 metricbeat]# systemctl enable --now metricbeat.service
 其它节点依次类推即可,最终效果如下:
完成下图配置后,最后退出设置模式
3.filebeat日志采集
文档:https://www.elastic.co/guide/en/beats/filebeat/7.6/filebeat-module-elasticsearch.html
[root@server1 ~]# rpm -ivh filebeat-7.6.1-x86_64.rpm
[root@server1 ~]# cd /etc/filebeat/modules.d
[root@server1 modules.d]# filebeat modules enable elasticsearch

[root@server1 modules.d]# vim elasticsearch.yml
- module: elasticsearch
  # Server log
  server:
    enabled: true

    # Set custom paths for the log files. If left empty,
    # Filebeat will choose the paths depending on your OS.
    var.paths:
      - /var/log/elasticsearch/*.log          # Plain text logs
      - /var/log/elasticsearch/*_server.json  # JSON logs

  gc:
    enabled: true
    # Set custom paths for the log files. If left empty,
    # Filebeat will choose the paths depending on your OS.
    var.paths:
      - /var/log/elasticsearch/gc.log.[0-9]*
      - /var/log/elasticsearch/gc.log

  audit:
    enabled: true
    # Set custom paths for the log files. If left empty,
    # Filebeat will choose the paths depending on your OS.
    var.paths:
      - /var/log/elasticsearch/*_access.log  # Plain text logs
      - /var/log/elasticsearch/*_audit.json  # JSON logs

  slowlog:
    enabled: true
    # Set custom paths for the log files. If left empty,
    # Filebeat will choose the paths depending on your OS.
    var.paths:
      - /var/log/elasticsearch/*_index_search_slowlog.log     # Plain text logs
      - /var/log/elasticsearch/*_index_indexing_slowlog.log   # Plain text logs
      - /var/log/elasticsearch/*_index_search_slowlog.json    # JSON logs
      - /var/log/elasticsearch/*_index_indexing_slowlog.json  # JSON logs

  deprecation:
    enabled: true
    # Set custom paths for the log files. If left empty,
    # Filebeat will choose the paths depending on your OS.
    var.paths:
      - /var/log/elasticsearch/*_deprecation.log   # Plain text logs
      - /var/log/elasticsearch/*_deprecation.json  # JSON logs
[root@server1 modules.d]# cd ..
[root@server1 filebeat]# vim filebeat.yml
...
output.elasticsearch:
  hosts: ["http://192.168.56.11:9200"]
  username: "elastic"
  password: "westos"

[root@server1 filebeat]# systemctl  enable --now filebeat.service
注意:若偶遇节点在配置后,web页面不显示,可以尝试重启elasticsearch节点服务

其它节点依次类推即可
