利用python进行数据分析之绘图和可视化--小白笔记
%matplotlib notebook
matplotlib API入门
import matplotlib.pyplot as plt
import numpy as np
import pandas as pd
data=np.arange(10)
data
array([0, 1, 2, 3, 4, 5, 6, 7, 8, 9])
plt.plot(data)
[]
Figure和Subplot
matplotlib的图像都位于Figure对象中。你可以用plt.figure创建一个新的Figure:
fig=plt.figure()
fig=plt.figure()
ax1=fig.add_subplot(2,2,1)
ax2=fig.add_subplot(2,2,2)
ax3=fig.add_subplot(2,2,3)
如果这时执行一条绘图命令(如plt.plot([1.5, 3.5, -2, 1.6])),matplotlib就会在最后
一个用过的subplot(如果没有则创建一个)上进行绘制,隐藏创建figure和subplot
的过程。
fig=plt.figure()
ax1=fig.add_subplot(2,2,1)
ax2=fig.add_subplot(2,2,2)
ax3=fig.add_subplot(2,2,3)
plt.plot(np.random.randn(50).cumsum(),'k--')
[]
fig=plt.figure()
ax1=fig.add_subplot(2,2,1)
ax2=fig.add_subplot(2,2,2)
ax3=fig.add_subplot(2,2,3)
plt.plot(np.random.randn(50).cumsum(),'k--')
ax1.hist(np.random.randn(100), bins=20, color='k', alpha=0.3)
ax2.scatter(np.arange(30), np.arange(30) + 3 * np.random.randn(30))
| 参数 | 说明 |
|---|---|
| nrows | subplot的行数 |
| ncols | subplot的列数 |
| sharex | 所有subplot应该使用相同的X轴刻度 |
| subplot_kw | 用于创建个subplot的关键字字典 |
| fig_kw | 创建figure时的其他关键字,如plt.subplots(2,2,figsize=(8,6)) |
调整subplot周围的间距
默认情况下,matplotlib会在subplot外围留下一定的边距,并在subplot之间留下一
定的间距。间距跟图像的高度和宽度有关,因此,如果你调整了图像大小(不管是
编程还是手工),间距也会自动调整。利用Figure的subplots_adjust方法可以轻而
易举地修改间距,此外,它也是个顶级函数:
subplots_adjust(left=None, bottom=None, right=None, top=None,wspace=None, hspace=None)
wspace和hspace用于控制宽度和高度的百分比,可以用作subplot之间的间距
fig, axes = plt.subplots(2, 2, sharex=True, sharey=True)
for i in range(2):
    for j in range(2):
        axes[i, j].hist(np.random.randn(500), bins=50, color='k', alpha=0.5)
plt.subplots_adjust(wspace=0, hspace=0)
颜色、标记和线型
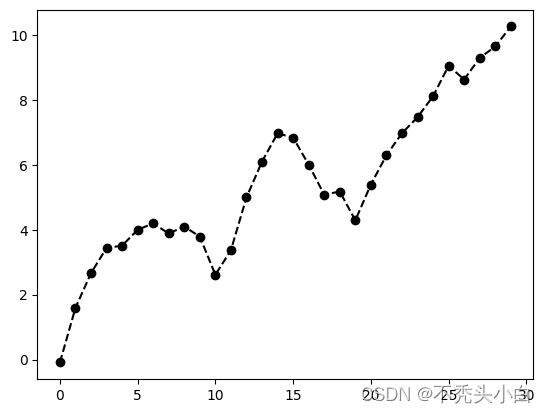
matplotlib的plot函数接受一组X和Y坐标,还可以接受一个表示颜色和线型的字符串
缩写。
ax.plot(x,y,‘g–’)ax.plot(x,y,linestyle=‘–’,color=‘g’)
常用的颜色可以使用颜色缩写,你也可以指定颜色码(例如,‘#CECECE’)。你可
以通过查看plot的文档字符串查看所有线型的合集
plt.plot(np.random.randn(30).cumsum(),'ko--')
[]
plt.plot(np.random.randn(30).cumsum(),color='k',linestyle='--',marker='o')
[]
data = np.random.randn(30).cumsum()
plt.plot(data, 'k--', label='Default')
plt.plot(data, 'k-', drawstyle='steps-post', label='steps-post')
plt.legend(loc='best')
设置标题、轴标签、刻度以及刻度标签
fig=plt.figure()
ax=fig.add_subplot(1,1,1)
ax.plot(np.random.randn(1000).cumsum())
[]
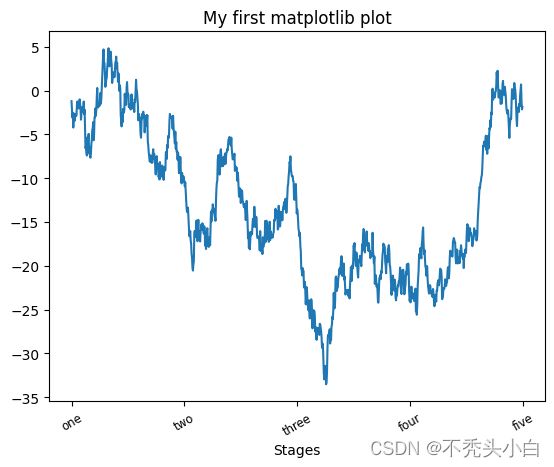
要改变x轴刻度,最简单的办法是使用set_xticks和set_xticklabels
fig=plt.figure()
ax=fig.add_subplot(1,1,1)
ax.plot(np.random.randn(1000).cumsum())
ticks=ax.set_xticks([0,250,500,750,1000])
labels=ax.set_xticklabels(['one','two','three','four','five'],rotation=30,fontsize='small')
#rotation选项设定x刻度标签倾斜30度
ax.set_xlabel('Stages')
ax.set_title('My first matplotlib plot')
Text(0.5, 1.0, 'My first matplotlib plot')
Y轴的修改方式与此类似,只需将上述代码中的x替换为y即可。轴的类有集合方
法,可以批量设定绘图选项。
props={
‘title’:‘My first matplotlib plot’
‘xlabel’:‘Stages’
}
ax.set(**props)
添加图例
图例(legend)是另一种用于标识图表元素的重要工具。添加图例的方式有多种。
最简单的是在添加subplot的时候传入label参数:
fig=plt.figure()
ax=fig.add_subplot(1,1,1)
ax.plot(np.random.randn(1000).cumsum(),'k',label='one')
ax.plot(np.random.randn(1000).cumsum(),'k--',label='two')
ax.plot(np.random.randn(1000).cumsum(),'k.',label='three')
ax.legend(loc='best')
注解以及在Subplot上绘图
除标准的绘图类型,你可能还希望绘制一些子集的注解,可能是文本、箭头或其他
图形等。注解和文字可以通过text、arrow和annotate函数进行添加
ax.text(x, y, ‘Hello world!’,family=‘monospace’, fontsize=10)
from datetime import datetime
fig = plt.figure()
ax = fig.add_subplot(1, 1, 1)
data = pd.read_csv('F:/项目学习/利用Pyhon进行数据分析(第二版)/利用Pyhon进行数据分析/pydata-book-2nd-edition/examples/spx.csv', index_col=0, parse_dates=True)
spx = data['SPX']
spx.plot(ax=ax, style='k-')
crisis_data = [
    (datetime(2007, 10, 11), 'Peak of bull market'),
    (datetime(2008, 3, 12), 'Bear Stearns Fails'),
    (datetime(2008, 9, 15), 'Lehman Bankruptcy')
]
for date, label in crisis_data:
    ax.annotate(label, xy=(date, spx.asof(date) + 75),
                xytext=(date, spx.asof(date) + 225),
                arrowprops=dict(facecolor='black', headwidth=4,
                                width=2,
                                headlength=4),
                horizontalalignment='left', verticalalignment='top')
# Zoom in on 2007-2010
ax.set_xlim(['1/1/2007', '1/1/2011'])
ax.set_ylim([600, 1800])
ax.set_title('Important dates in the 2008-2009 financial crisis')
Text(0.5, 1.0, 'Important dates in the 2008-2009 financial crisis')
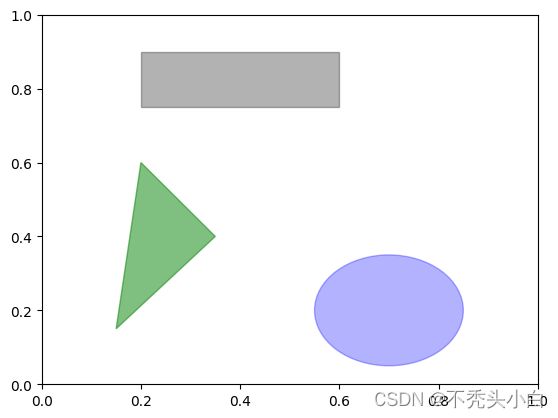
fig = plt.figure()
ax = fig.add_subplot(1, 1, 1)
rect = plt.Rectangle((0.2, 0.75), 0.4, 0.15, color='k', alpha=0.3)
circ = plt.Circle((0.7, 0.2), 0.15, color='b', alpha=0.3)
pgon = plt.Polygon([[0.15, 0.15], [0.35, 0.4], [0.2, 0.6]],color='g', alpha=0.5)
ax.add_patch(rect)
ax.add_patch(circ)
ax.add_patch(pgon)
将图表保存到文件
利用plt.savefig可以将当前图表保存到文件。该方法相当于Figure对象的实例方法
savefig。例如,要将图表保存为SVG文件,你只需输入
plt.savefig(‘figpath.svg’)
文件类型是通过文件扩展名推断出来的。因此,如果你使用的是.pdf,就会得到一
个PDF文件。我在发布图片时最常用到两个重要的选项是dpi(控制“每英寸点数”分
辨率)和bbox_inches(可以剪除当前图表周围的空白部分)
plt.savefig(‘figpath.png’, dpi=400, bbox_inches=‘tight’)
savefig并非一定要写入磁盘,也可以写入任何文件型的对象,比如BytesIO:
from io import BytesIO
buffer = BytesIO()
plt.savefig(buffer)
plot_data = buffer.getvalue()
savefig的其它选项
| 参数 | 说明 |
|---|---|
| fname | 含有文件路径的字符串或python的文件型对象 |
| dpi | 图像分辨率(每英寸点数),默认为100 |
| facecolor、edgecolor | 图像的背景色,默认为‘w’(白色) |
| format | 显式设置文件格式(png、pdf、svg…) |
| bbox_inches | 图表需要保存的部分 |
使用pandas和seaborn绘图
线形图
s=pd.Series(np.random.randn(10).cumsum(),index=np.arange(0,100,10))
s.plot()
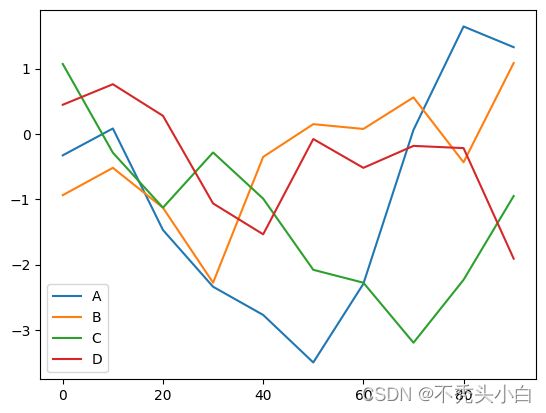
df = pd.DataFrame(np.random.randn(10, 4).cumsum(0),
                  columns=['A', 'B', 'C', 'D'],
                  index=np.arange(0, 100, 10))
df
| A | B | C | D | |
|---|---|---|---|---|
| 0 | -0.328178 | -0.937408 | 1.069664 | 0.446050 |
| 10 | 0.082734 | -0.519257 | -0.287599 | 0.759948 |
| 20 | -1.470532 | -1.130326 | -1.128459 | 0.276776 |
| 30 | -2.338755 | -2.276585 | -0.284231 | -1.064264 |
| 40 | -2.770433 | -0.352019 | -0.990814 | -1.536565 |
| 50 | -3.497771 | 0.149083 | -2.079692 | -0.078499 |
| 60 | -2.293681 | 0.075971 | -2.276931 | -0.519354 |
| 70 | 0.061288 | 0.558535 | -3.195277 | -0.183334 |
| 80 | 1.643792 | -0.434300 | -2.232554 | -0.217443 |
| 90 | 1.326786 | 1.084292 | -0.950808 | -1.909138 |
df.plot()
柱状图
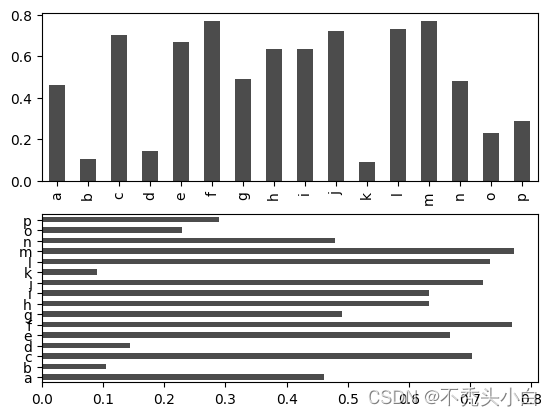
plot.bar()和plot.barh()分别绘制水平和垂直的柱状图。这时,Series和DataFrame的
索引将会被用作X(bar)或Y(barh)刻度
fig, axes = plt.subplots(2, 1)
data = pd.Series(np.random.rand(16), index=list('abcdefghijklmnop'))
data.plot.bar(ax=axes[0], color='k', alpha=0.7)
data.plot.barh(ax=axes[1], color='k', alpha=0.7)
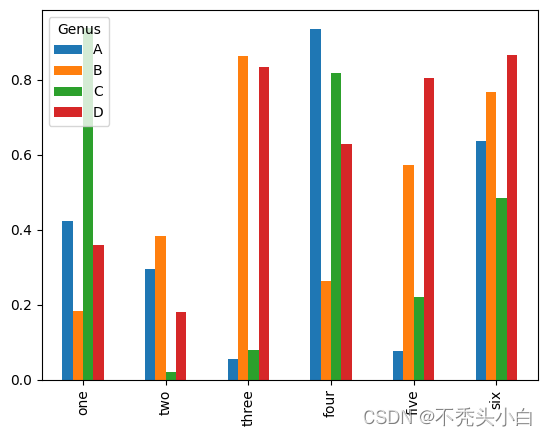
df = pd.DataFrame(np.random.rand(6, 4),
                  index=['one', 'two', 'three', 'four','five', 'six'],
                  columns=pd.Index(['A', 'B', 'C', 'D'],name='Genus'))

df
| Genus | A | B | C | D |
|---|---|---|---|---|
| one | 0.421760 | 0.183322 | 0.938769 | 0.358988 |
| two | 0.295460 | 0.382762 | 0.021034 | 0.178810 |
| three | 0.055834 | 0.862129 | 0.079981 | 0.832899 |
| four | 0.935701 | 0.262838 | 0.818458 | 0.628460 |
| five | 0.077205 | 0.571542 | 0.221106 | 0.805360 |
| six | 0.636606 | 0.767645 | 0.485035 | 0.865025 |
df.plot.bar()
设置stacked=True即可为DataFrame生成堆积柱状图,这样每行的值就会被堆积在
一起
df.plot.barh(stacked=True,alpha=0.7)
笔记:柱状图有一个非常不错的用法:利用value_counts图形化显示Series中
各值的出现频率,比如s.value_counts().plot.bar()。
tips=pd.read_csv('F:/项目学习/利用Pyhon进行数据分析(第二版)/利用Pyhon进行数据分析/pydata-book-2nd-edition/examples/tips.csv')
tips
| total_bill | tip | smoker | day | time | size | |
|---|---|---|---|---|---|---|
| 0 | 16.99 | 1.01 | No | Sun | Dinner | 2 |
| 1 | 10.34 | 1.66 | No | Sun | Dinner | 3 |
| 2 | 21.01 | 3.50 | No | Sun | Dinner | 3 |
| 3 | 23.68 | 3.31 | No | Sun | Dinner | 2 |
| 4 | 24.59 | 3.61 | No | Sun | Dinner | 4 |
| ... | ... | ... | ... | ... | ... | ... |
| 239 | 29.03 | 5.92 | No | Sat | Dinner | 3 |
| 240 | 27.18 | 2.00 | Yes | Sat | Dinner | 2 |
| 241 | 22.67 | 2.00 | Yes | Sat | Dinner | 2 |
| 242 | 17.82 | 1.75 | No | Sat | Dinner | 2 |
| 243 | 18.78 | 3.00 | No | Thur | Dinner | 2 |
244 rows × 6 columns
party_counts=pd.crosstab(tips['day'],tips['size'])
party_counts
| size | 1 | 2 | 3 | 4 | 5 | 6 |
|---|---|---|---|---|---|---|
| day | ||||||
| Fri | 1 | 16 | 1 | 1 | 0 | 0 |
| Sat | 2 | 53 | 18 | 13 | 1 | 0 |
| Sun | 0 | 39 | 15 | 18 | 3 | 1 |
| Thur | 1 | 48 | 4 | 5 | 1 | 3 |
party_counts=party_counts.loc[:,2:5]
party_counts
| size | 2 | 3 | 4 | 5 |
|---|---|---|---|---|
| day | ||||
| Fri | 16 | 1 | 1 | 0 |
| Sat | 53 | 18 | 13 | 1 |
| Sun | 39 | 15 | 18 | 3 |
| Thur | 48 | 4 | 5 | 1 |
#进行规格化,使得各行的和为1,并生成图表
party_pcts=party_counts.div(party_counts.sum(1),axis=0)
party_pcts
| size | 2 | 3 | 4 | 5 |
|---|---|---|---|---|
| day | ||||
| Fri | 0.888889 | 0.055556 | 0.055556 | 0.000000 |
| Sat | 0.623529 | 0.211765 | 0.152941 | 0.011765 |
| Sun | 0.520000 | 0.200000 | 0.240000 | 0.040000 |
| Thur | 0.827586 | 0.068966 | 0.086207 | 0.017241 |
party_pcts.plot.bar()
import seaborn as sns
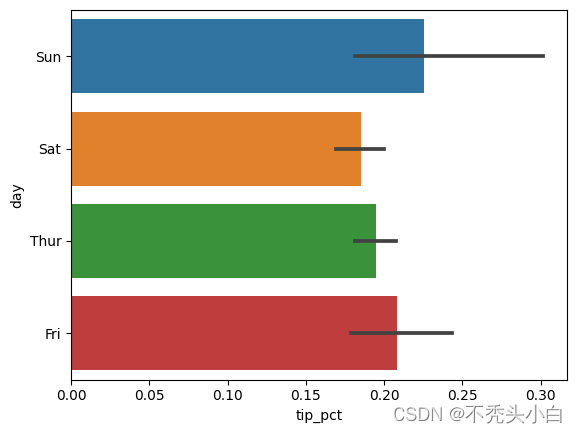
tips['tip_pct'] = tips['tip'] / (tips['total_bill'] - tips['tip'])
tips.head()
| total_bill | tip | smoker | day | time | size | tip_pct | |
|---|---|---|---|---|---|---|---|
| 0 | 16.99 | 1.01 | No | Sun | Dinner | 2 | 0.063204 |
| 1 | 10.34 | 1.66 | No | Sun | Dinner | 3 | 0.191244 |
| 2 | 21.01 | 3.50 | No | Sun | Dinner | 3 | 0.199886 |
| 3 | 23.68 | 3.31 | No | Sun | Dinner | 2 | 0.162494 |
| 4 | 24.59 | 3.61 | No | Sun | Dinner | 4 | 0.172069 |
sns.barplot(x='tip_pct',y='day',data=tips,orient='h')
sns.barplot(x='tip_pct', y='day', hue='time', data=tips, orient='h')
直方图和密度图
直方图(histogram)是一种可以对值频率进行离散化显示的柱状图。数据点被拆分
到离散的、间隔均匀的面元中,绘制的是各面元中数据点的数量
tips['tip_pct'].plot.hist(bins=50)
tips['tip_pct'].plot.density()
comp1 = np.random.normal(0, 1, size=200)
comp2 = np.random.normal(10, 2, size=200)
values = pd.Series(np.concatenate([comp1, comp2]))
sns.distplot(values, bins=100, color='k')
散布图或点图
点图或散布图是观察两个一维数据序列之间的关系的有效手段。
macro=pd.read_csv('F:/项目学习/利用Pyhon进行数据分析(第二版)/利用Pyhon进行数据分析/pydata-book-2nd-edition/examples/macrodata.csv')
data=macro[['cpi','m1','tbilrate','unemp']]
trans_data=np.log(data).diff().dropna()
trans_data[-5:]
| cpi | m1 | tbilrate | unemp | |
|---|---|---|---|---|
| 198 | -0.007904 | 0.045361 | -0.396881 | 0.105361 |
| 199 | -0.021979 | 0.066753 | -2.277267 | 0.139762 |
| 200 | 0.002340 | 0.010286 | 0.606136 | 0.160343 |
| 201 | 0.008419 | 0.037461 | -0.200671 | 0.127339 |
| 202 | 0.008894 | 0.012202 | -0.405465 | 0.042560 |
sns.regplot(x='m1', y='unemp', data=trans_data)
plt.title('Changes in log m1 versus log unemp')
Text(0.5, 1.0, 'Changes in log m1 versus log unemp')
在探索式数据分析工作中,同时观察一组变量的散布图是很有意义的,这也被称为
散布图矩阵(scatter plot matrix)。纯手工创建这样的图表很费工夫,所以
seaborn提供了一个便捷的pairplot函数,它支持在对角线上放置每个变量的直方图
或密度估计
sns.pairplot(trans_data, diag_kind='kde', plot_kws={'alpha': 0.2})
分面网格(facet grid)和类型数据
seaborn有一个有用的内置函数catplot,可以简化制作多种分面图
sns.catplot(x='day', y='tip_pct', hue='time', col='smoker',kind='bar', data=tips[tips.tip_pct < 1])
除了在分面中用不同的颜色按时间分组,我们还可以通过给每个时间值添加一行来
扩展分面网格:
sns.catplot(x='day', y='tip_pct', row='time',col='smoker',kind='bar', data=tips[tips.tip_pct < 1])
sns.catplot(x='tip_pct', y='day', kind='box',data=tips[tips.tip_pct < 0.5])


