一、使用 docker-compose 安装 Prometheus+Alertmanager+Grafana
安装 docker-compose
grafana 官网
有的时候官方下载连接会失败,所以这里选择docker镜像来进行安装部署,被墙的头晕
准备
[root@k8s-master ~]# mkdir -p /home/monitor/prometheus/config/rules
[root@k8s-master ~]# mkdir -p /home/monitor/grafana/config
步骤
- 部署 Prometheus
- 部署 Alertmanager
- 与 Prometheus 建立连接
- 使用 Prometheus 配置报警规则
1.创建 docker-compose.yml 配置文件
[root@k8s-master monitor]# pwd
/home/monitor
[root@k8s-master monitor]# cat > docker-compose.yml << eric
# 指定 docker-compose 编译版本,这个很重要
version: '2'
services:
  # 添加 普罗米修斯服务
  prometheus:
    # Docker Hub 镜像
    image: prom/prometheus:latest
    # 容器名称
    container_name: prometheus
    # 容器内部 hostname
    hostname: prometheus
    # 容器支持自启动
    restart: always
    # 容器与宿主机 端口映射
    ports:
      - '9090:9090'
    # 将宿主机中的config文件夹,挂载到容器中/config文件夹
    volumes:
      - './prometheus/config:/config'
      - './prometheus/data/prometheus:/prometheus/data'
    # 指定容器中的配置文件
    command:
      - '--config.file=/config/prometheus.yml'
      # 支持热更新
      - '--web.enable-lifecycle'
      # 保留90天的数据(默认保留15天的数据)
      - '--storage.tsdb.retention.time=90d'

  # 添加告警模块
  alertmanager:
    image: prom/alertmanager:latest
    container_name: alertmanager
    hostname: alertmanager
    restart: always
    ports:
      - '9093:9093'
    volumes:
      - './prometheus/config:/config'
      - './prometheus/data/alertmanager:/alertmanager/data'
    command:
      - '--config.file=/config/alertmanager.yml'

  # 添加监控可视化面板
  grafana:
    image: grafana/grafana:latest
    container_name: grafana
    hostname: grafana
    restart: always
    ports:
      - '3000:3000'
    volumes:
      # 配置grafana 邮件服务器
      - './grafana/config/grafana.ini:/etc/grafana/grafana.ini'
      - './grafana/data:/var/lib/grafana'
eric

[root@k8s-master monitor]#
2.添加告警模块配置文件 alertmanager.yml
[root@k8s-master config]# pwd
/home/monitor/prometheus/config
[root@k8s-master config]# cat > alertmanager.yml << eric
global:
  resolve_timeout: 1m
  # The smarthost and SMTP sender used for mail notifications.
  #smtp_smarthost: ''
  #smtp_from: ''
  #smtp_auth_username: ''
  #smtp_auth_password: ''

route:
  receiver: 'default-receiver'
    # The labels by which incoming alerts are grouped together. For example,
  # multiple alerts coming in for cluster=A and alertname=LatencyHigh would
  # be batched into a single group.
  #group_by: ['alertname']

  # When a new group of alerts is created by an incoming alert, wait at
  # least 'group_wait' to send the initial notification.
  # This way ensures that you get multiple alerts for the same group that start
  # firing shortly after another are batched together on the first
  # notification.
  # group_wait: 5s

  # When the first notification was sent, wait 'group_interval' to send a batch
  # of new alerts that started firing for that group.
  # group_interval: 30s

  # If an alert has successfully been sent, wait 'repeat_interval' to
  # resend them.
  repeat_interval: 1m
receivers:
  - name: 'default-receiver'
eric

[root@k8s-master config]#
3.配置 普罗米修斯配置文件 prometheus.yml
[root@k8s-master config]# pwd
/home/monitor/prometheus/config
[root@k8s-master config]# cat > prometheus.yml << eric
# 全局配置文件(可替换)
global:
  scrape_interval:     60s # By default, scrape targets every 15 seconds.

  # Attach these labels to any time series or alerts when communicating with
  # external systems (federation, remote storage, Alertmanager).
  external_labels:
    monitor: 'line-monitor'

# 普罗米修斯 规则文件
rule_files:
  - "rules/*.yml"

# prometheus自身的Alert功能是根据我们配置的 规则文件 进行触发的,但是它并没有告警发邮件的功能,发送邮件的这件事儿是由 Alertmanager来做的
alerting:
  alertmanagers:
  - scheme: http
    static_configs:
    - targets:
#      - "192.168.180.32:9093"

# A scrape configuration containing exactly one endpoint to scrape:
# Here it's Prometheus itself.
scrape_configs:
  # The job name is added as a label `job=` to any timeseries scraped from this config.
 # - job_name: 'dev10-prometheus'
    # metrics_path defaults to '/metrics'
    # scheme defaults to 'http'.
 #   static_configs:
 #     - targets: ['localhost:9090']

  - job_name: 'hrbm-UAT-mysql'
    static_configs:
      - targets: ['192.168.180.32:9104']

  - job_name: 'hrbm-PROD-mysql'
    static_configs:
      - targets: ['192.168.180.32:9105']

  - job_name: 'node-monitor-32'
    static_configs:
      - targets: ['192.168.192.11:9100','192.168.192.12:9100','192.168.192.13:9100']

  - job_name: 'RabbitMQ-UAT'
    static_configs:
      - targets: ['192.168.180.32:9106']
  - job_name: 'redis-pressure'
    static_configs:
      - targets: ['192.168.180.32:9107']

  - job_name: "blackbox_telnet_port"
    #scrape_interval: 15s
    metrics_path: /probe
    params:
      module: [tcp_connect]
    static_configs:
      - targets: [ 'sft-ap.pfizer.com:22' ]
        labels:
          group: 'pfizer'
    relabel_configs:
      - source_labels: [__address__]
        target_label: __param_target
      - source_labels: [__param_target]
        target_label: instance
      - target_label: __address__
        replacement: 192.168.180.32:9115

  - job_name: '科伦-生产-blackbox'
    metrics_path: /probe
    # 监听 response
    params:
      # 响应的状态码
      module: [http_2xx]  # Look for a HTTP 200 response.
    # 要监听的url
    static_configs:
      - targets:
        - https://kelun.sinoeyes.com:38888/kelun/rest/web/login/login.html

    relabel_configs:
      # __address__:当前Target实例的访问地址:
      # __scheme__:采集目标服务访问地址的HTTP Scheme,HTTP或者HTTPS
      # __metrics_path__:采集目标服务访问地址的访问路径
      # __param_:采集任务目标服务的中包含的请求参数
      - source_labels: [__address__]
        target_label: __param_target
      - source_labels: [__param_target]
        target_label: instance
      - target_label: __address__
        # 指定 blackbox 服务模块的访问地址
        replacement: 192.168.180.32:9115  # The blackbox exporter's real hostname:port.
eric

[root@k8s-master config]#
4.添加 普罗米修斯 告警规则文件 mysql-rules.yml (mysql相关的监控规则)
[root@k8s-master rules]# pwd
/home/monitor/prometheus/config/rules
[root@k8s-master rules]# cat > mysql-rules.yml << eric
groups:
  - name: SiteDown
    rules:
    - alert: 'MySql离线监控告警'
      # 如果 prometheus 抓取到的mysql_up为0时,则表示监控的mysql已经是离线状态
      # up{instance="k8s.dev-share.top:9104",job="mysql"} 这个语法是在 prometheus web页面中--> Graph 里面查到的,这个说法是可以获取到被监控的mysql在线的数据; 等于0为离线
      expr: up{instance="k8s.dev-share.top:9104",job="mysql"} == 0
      #for: 30s
      for: 5s
      annotations:
        summary: "MySql离线监控告警 : {{.instance}}"
        description: "MySql离线监控告警 : {{.instance}}"
        custom: "mysql"

    - alert: 'Prometheus 离线监控告警'
      # 等于0时,将触发告警
      expr: up{instance="k8s.dev-share.top:9090",job="prometheus"} == 0
      for: 30s
      annotations:
        summary: "Prometheus 离线监控告警 : {{.instance}}"
        description: "Prometheus 离线监控告警 : {{.instance}}"
        custom: "prometheus"
eric

[root@k8s-master rules]#
5.添加grafana配置文件 grafana.ini
[root@dev10 config]# pwd
/home/monitor/grafana/config
[root@dev10 config]# cat > grafana.ini << eric
#################################### SMTP / Emailing ##########################
# 配置邮件服务器
[smtp]
enabled = true
# 发件服务器
host = smtp.exmail.qq.com:465
# smtp账号
user = gsk-portal@pharmeyes.com
# smtp 密码
password = smtp的密码
# 发信邮箱
from_address = gsk-portal@pharmeyes.com
# 发信人
from_name = Grafana
eric

[root@dev10 config]#
6.启动
[root@k8s-master monitor]# pwd
/home/monitor
[root@k8s-master monitor]# docker-compose up -d
Creating network "monitor_default" with the default driver
Creating alertmanager ... done
Creating prometheus   ... done
Creating grafana      ... done
[root@k8s-master monitor]#
# 如果启动后,有挂载盘权限问题,解决如下:虽然此方法并不好,暂时还没有更好的办法
[root@k8s-master home]# chmod -R 777 monitor/
总结,alertmanager 是给 prometheus 本身的alert用的,它是用来告警后触发邮件;
而我们现在使用 Grafana 是在Grafana 的监控面板中 Alerts选项直接可以配置的告警语句的,告警的查询语句可以去 prometheus web页面 --> Graph中 查询
所以在部署使用的时候不要弄混, Alertmanager 与 grafana 中的 alert 它俩没有任何关系
Grafana 关联 普罗米修斯
Configuration --> Data Sources --> Add data source --> Prometheus
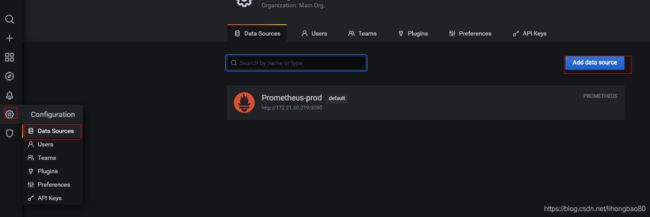

配置 Prometheus
| key | value |
|---|---|
| Name: | Prometheus |
| URL: | http://k8s.dev-share.top:9090 |
| Access: | Server(Default) |
| Whitelisted Cookies: | Prometheus |
| HTTP Method: | GET |
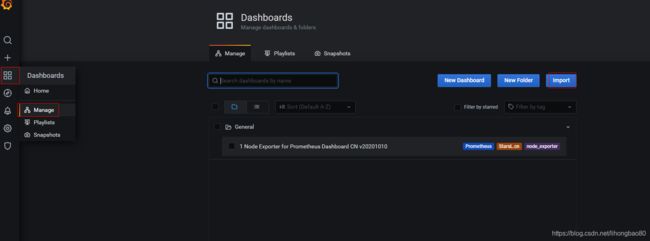
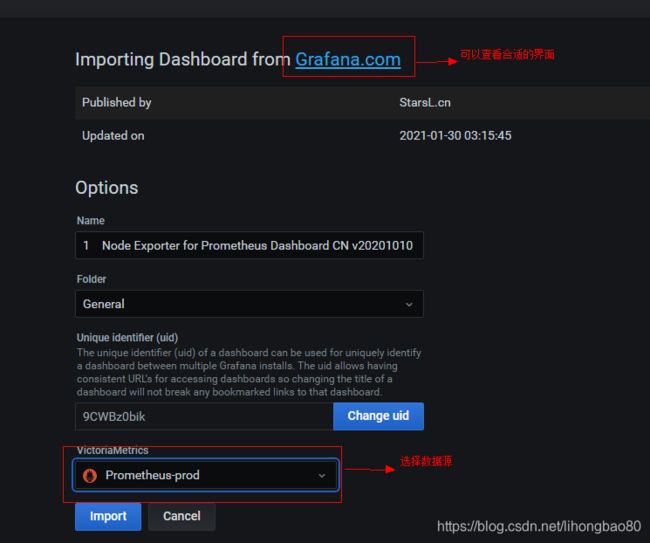
常用的grafana面板导入

K8S 监控面板 ID: 7532
MySQL 监控面板 ID: 7362
Blackbox 监控面板 ID: 9965
node 监控面板 ID: 8919
监控容器: 3146 8685 10000 8588 315
监控物理机/虚拟机(linux) : 8919 9276
监控物理机/虚拟机(windows) : 10467 10171 2129
监控协议http/icmp/tcp/dns/
http监控某个网站
icmp监控某台机器
tcp监控某个端口
dns监控dns
推荐ID
9965
优化9965
Grafana 安装插件 饼图
[root@k8s-master monitor]# docker exec grafana grafana-cli plugins install grafana-piechart-panel

[root@k8s-master monitor]# docker-compose restart grafana
Grafana 添加报警接收者
Alerting --> Notification channels --> Add channel
普罗米修斯热更新
注意:Only POST or PUT requests allowed 只允许 POST 或 PUT 请求
[root@k8s-master ~]# curl -X POST http://192.168.180.32:9090/-/reload