element ui+echarts实现走马灯
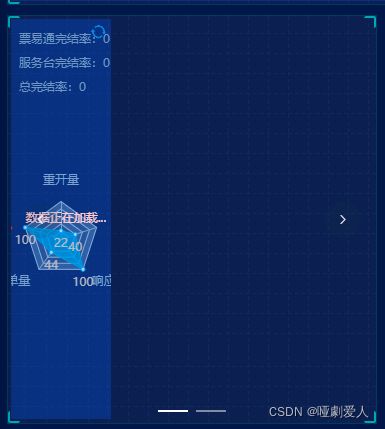
这个是效果图,再不改变宽口大小的时候echats的图标是图一,改变窗口大小之后才会自适应。
未改变窗口大小:
改变窗口大小之后,图像就会自适应。

HTML代码
<div id="stairOne" class="stairOne" style="width:35%;">
                <!-- 雷达轮播图 -->
                <el-carousel height="409px" :autoplay="false">
                    <el-carousel-item>
                        <div class="panel" style="height: 409px;margin-bottom: 0px;">
                            <div id="Map-cal-proportionChart" style="width:100%"></div>
                            <div class="panel-footer"></div>
                        </div>
                    </el-carousel-item>
                    <el-carousel-item>
                        <div class="panel" style="height: 409px;margin-bottom: 0px;">
                            <div id="Map-cal-proportionChart2" style="width:100%"></div>
                            <div class="panel-footer"></div>
                        </div>
                    </el-carousel-item>
                </el-carousel>
                <!--<div class="panel">
                    <div id="Map-cal-proportionChart"></div>
                    <div class="panel-footer"></div>
                </div>-->
            </div>
js代码
//雷达图的轮播图初始化
        var Carousel = new Vue({
            el: "#stairOne",
            data: {},
            mounted: function () {
                initMap();
                //var a = $("#stairOne").width() - 10;
                //$("#Map-cal-proportionChart").width(a);
                //$("#Map-cal-proportionChart2").width(a);
            }
        });
initMap 初始化方法
function initMap() {
    proportionChartInstantiation = echarts.init(document.getElementById('Map-cal-proportionChart'));
    proportionChartInstantiation2 = echarts.init(document.getElementById('Map-cal-proportionChart2'));
    //图5服务台单量分布
    proportionChart = {
        color: colors,
        toolbox: {
            show: true,
            feature: {
                myTool2: {
                    show: true,
                    title: '刷新',
                    icon: 'image://../../images/刷新.png',
                    onclick: function () {
                        MapPersonList4("false");
                    }
                }
            }
        },
        title: {
            subtext: '票易通完结率:0\n\n服务台完结率:0\n\n总完结率:0',
            //top: 5,
            left: "3%",
            textStyle: {
                //文字颜色
                color: textcolor
            }
        },
        tooltip: {
            trigger: 'item'
        },
        radar: {
            center: ['50%', '55%'],//位置
            indicator: [
                { text: '重开量', max: 100 },
                { text: '关单量', max: 100 },
                { text: '转单量', max: 100 },
                { text: '响应量', max: 100 },
                { text: '触碰量', max: 100 }
            ]
        },
        series: {
            name: '工单汇总',
            type: 'radar',
            //symbol: 'none',
            areaStyle: {},
            label: {
                show: true,
                position: 'bottom',
                color: 'navajowhite'
            },
            //设置仪表盘位置
            lineStyle: {
                width: 1
            },
            emphasis: {
                areaStyle: {
                    color: 'rgba(0,250,0,0.3)'
                }
            },
            data: [{
                value: [22, 100, 44, 100, 40]
            }]
        }
    };

    proportionChart2 = {
        color: colors,
        toolbox: {
            show: true,
            feature: {
                myTool2: {
                    show: true,
                    title: '刷新',
                    icon: 'image://../../images/刷新.png',
                    onclick: function () {
                        MapPersonList4("false");
                    }
                }
            }
        },
        title: {
            subtext: '票易通完结率:0\n\n服务台完结率:0\n\n总完结率:0',
            //top: 5,
            left: "3%",
            textStyle: {
                //文字颜色
                color: textcolor
            }
        },
        tooltip: {
            trigger: 'item'
        },
        radar: {
            center: ['50%', '55%'],//位置
            indicator: [
                { text: '服务台', max: 100 },
                { text: '关单量', max: 100 },
                { text: '转单量', max: 100 },
                { text: '响应量', max: 100 },
                { text: '触碰量', max: 100 }
            ]
        },
        series: {
            name: '工单汇总',
            type: 'radar',
            //symbol: 'none',
            areaStyle: {},
            label: {
                show: true,
                position: 'bottom',
                color: 'navajowhite'
            },
            //设置仪表盘位置
            lineStyle: {
                width: 1
            },
            emphasis: {
                areaStyle: {
                    color: 'rgba(0,250,0,0.3)'
                }
            },
            data: [{
                value: [22, 33, 44, 100, 40]
            }]
        }
    };
    proportionChartInstantiation.setOption(proportionChart)
    proportionChartInstantiation2.setOption(proportionChart2)
    // 当浏览器缩放的时候,图表也等比例缩放
    window.addEventListener("resize", function () {
        // 让图表调用 resize这个方法
        proportionChartInstantiation.resize();
        proportionChartInstantiation2.resize();
    });
};
有那个大神能帮忙解答一下,已经设置了echarts容器的宽度为100%,实际再打断点测试的时候在new Vue 中运行的时候是100px,但是页面加载完成后F12看容器是没有问题的是100%宽度。是在不知道哪里出问题了,可能是element 的走马灯初始化在echarts图初始化之前运行。但是不太清楚怎么调整了。请大神指导
已解决,记录一下。自己太笨了。
//雷达图的轮播图初始化
        var Carousel = new Vue({
            el: "#stairOne",
            data: {},
            mounted: function () {
                initMap();
                //获取容器对象
                var myChart = echarts.init(document.getElementById('Map-cal-proportionChart'));
                var myChart2 = echarts.init(document.getElementById('Map-cal-proportionChart2'));
                this.$nextTick(() => {
                //调用echarts的resize
                    myChart.resize();
                    myChart2.resize();
                })
                //var a = $("#stairOne").width() - 10;
                //$("#Map-cal-proportionChart").width(a);
                //$("#Map-cal-proportionChart2").width(a);
            }
        });