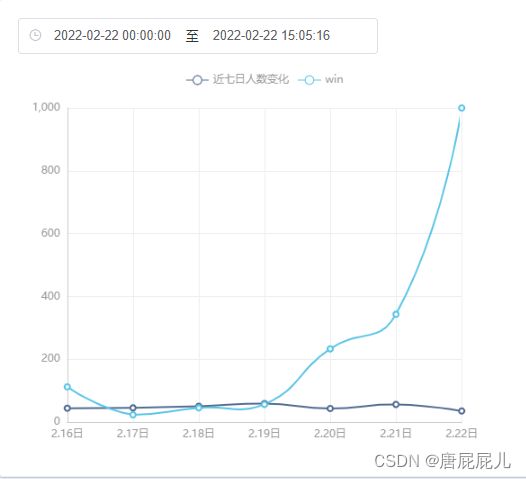
vue+element+echarts 曲线折线图
两个示例 ① id=chartLineBox ② id=main1
页面引用echarts和westeros
import '../util/westeros'
import echarts from 'echarts'
export default {
  name: 'echarts1',
  data() {
    return {
    }
  },
}
① chartLineBox 结合后台接口传数据使用实例
    async selectUserStatistics() {
      let self = this
      const { data: result } = await this.$http.get('admin/userStatistics/selectUserStatistics', {
        params: {
          registerTime: self.params.registerTime,
          beExtantTime: self.params.beExtantTime
        }
      })
      if (result.status !== 1001) return this.$message.error(result.message)
      result.data.appSaleData.forEach(function(item, index) {
        // item 就是当日按循环到的对象
        // index是循环的索引,从0开始
        self.xData.push(item.calendar + '日') // push()在数组末端添加一条数据
        self.yData.push(parseInt(item.sum)) // push()在数组末端添加一条数据
      })

      this.chartLine = this.$echarts.init(document.getElementById('chartLineBox'), 'westeros')
      // 指定图表的配置项和数据
      var option = {
        xAxis: {
          type: 'category',
          boundaryGap: false,
          data: this.xData
        },
        yAxis: {
          type: 'value'
        },
        tooltip: {
          // 鼠标悬浮交互时的信息提示
          trigger: 'axis', // 触发类型
          enterable: true,
          backgroundColor: 'rgba(0,0,0,0.7)', // 提示背景颜色
          borderColor: '#ccc', // 提示边框色
          borderRadius: 4, // 提示圆角
          borderWidth: 2, // 提示边框宽度
          padding: 10, // 提示padding
          axisPointer: {
            // 坐标轴指示器,默认type为line
            type: 'line',
            label: {
              backgroundColor: '#6a7985'
            }
          },
          textStyle: {
            color: '#ccc' // 提示文本字体
          }
        },
        legend: {
          // 图例
          data: ['近七日人数变化'], // 图例名称
          x: 'center', // 图例水平位置
          y: '18px', // 图例垂直位置
          // backgroundColor: '#ccc', // 图例背景色
          itemHeight: 12, // 图例图形高度
          textStyle: {}
          // formatter:"hello world" // 文本格式器
        },
        series: [
          {
            name: '近七日人数变化',
            type: 'line',
            // symbol: 'circle', // 设置标记的图形为circle
            // areaStyle: {
            //   normal: {
            //     color: '#6B7CFF' // 改变区域颜色
            //   }
            // },
            // stack: '总量',
            data: this.yData
          }
        ]
      }
      option.legend.data.push('win')
      option.series.push({
        name: 'win', //  系列名称
        type: 'line', //  图表类型,折线图line、散点图scatter、柱状图bar、饼图pie、雷达图radar
        data: [112, 23, 45, 56, 233, 343, 1000]
      })
      // 使用刚指定的配置项和数据显示图表。
      this.chartLine.setOption(option)
    },
② main1 完整示例
initChart2() {
      var option = {
        backgroundColor: '', // 全局背景色
        color: [
          // 数值背景色颜色列表,当系列数量个数比颜色列表长度大时将循环选取
          '#ff7f50',
          '#87cefa',
          '#da70d6',
          '#32cd32',
          '#6495ed',
          '#ff69b4',
          '#ba55d3',
          '#cd5c5c',
          '#ffa500',
          '#40e0d0',
          '#1e90ff',
          '#ff6347',
          '#7b68ee',
          '#00fa9a',
          '#ffd700',
          '#6699FF',
          '#ff6666',
          '#3cb371',
          '#b8860b',
          '#30e0e0'
        ],
        animation: true, // 图表初始化动画是否展示
        title: {
          // 图表标题
          show: true, // 控制图表题目是否显示
          text: '堆叠区域图', // 图表题目
          backgroundColor: '#ccc', // 图表题目颜色
          textAlign: 'left', // 图表题目位置
          link: 'www.baidu.com', // 标题设置超文本链接
          target: 'blank', // 打开超链接的方式
          subtext: '我是echarts', // 设置副标题'\n'指定换行
          sublink: 'www.baidu.com', // 副标题超文本链接
          subtarget: '', // 副标题打开方式
          x: 'left', // 标题水平位置默认为左侧,可选为:'center' | 'left' | 'right' | {number}(x坐标,单位px)
          y: 'top', // 标题垂直安放位置,默认为全图顶端,可选为:'top' | 'bottom' | 'center' | {number}(y坐标,单位px)
          textAlign: '', // 水平对齐方式,默认根据x设置自动调整,可选为: left' | 'right' | 'center
          borderColor: '#000000', // 标题边框
          borderWidth: '2', // 边框宽
          padding: '', // 默认各方向内边距为5,接受数组分别设定上右下左边距,同css
          // itemGap:"",// 主副标题纵向间隔,单位px,默认为10
          textStyle: {
            // 标题文本样式
            fontSize: 18,
            fontWeight: 'bolder',
            color: '#333',
            fontFamily: ''
          },
          subtextStyle: {
            // 副标题文本样式
          }
        },
        tooltip: {
          // 鼠标悬浮交互时的信息提示
          // show:false,
          // showContent:false,
          trigger: 'axis', // 触发类型
          enterable: true,
          backgroundColor: 'rgba(0,0,0,0.7)', // 提示背景颜色
          borderColor: '#ccc', // 提示边框色
          borderRadius: 4, // 提示圆角
          borderWidth: 2, // 提示边框宽度
          padding: 10, // 提示padding
          axisPointer: {
            // 坐标轴指示器,默认type为line
            type: 'line',
            label: {
              backgroundColor: '#6a7985'
            }
          },
          textStyle: {
            color: '#ccc' // 提示文本字体
          }
        },
        legend: {
          // 图例
          data: ['邮件营销', '联盟广告', '视频广告', '直接访问', '搜索引擎'], // 图例名称
          x: 'center', // 图例水平位置
          y: 'top', // 图例垂直位置
          // backgroundColor: '#ccc', // 图例背景色
          itemHeight: 20, // 图例图形高度
          textStyle: {}
          // formatter:"hello world" // 文本格式器
        },
        toolbox: {
          // 工具箱
          show: true,
          // orient:"horizontal",
          // x:"",// 显示位置
          // y:"",// 显示位置
          backgroundColor: '#ccc', // 工具箱背景色
          borderColor: '',
          borderWidth: '',
          padding: '', // 内部padding
          itemGap: '', // 各个item之间的间隔
          itemSize: '30', // 工具箱大小
          showTitle: false, // 是否显示工具箱文字提示,默认启用
          textStyle: {}, // 工具箱提示文字样式
          feature: {
            mark: {
              show: true,
              title: {
                mark: '辅助线开关'
              }
            },
            //  dataZoom:{
            //      show:true,
            //  },
            saveAsImage: {} // 保存为图片
          }
        },
        grid: {
          // 直角坐标系内绘图网格
          left: '3%',
          right: '4%',
          bottom: '3%',
          containLabel: true
          // width:"50%", // 图表占整体的多少
          // height:"",
        },
        xAxis: [
          // 坐标轴类型,横轴默认为类目型'category'
          {
            type: 'category',
            // show:false, // x轴是否显示
            axisLine: {
              // onZero:false, // 定位到垂直方向的0值坐标上
              // show:false,
              lineStyle: {
                color: '#ccc',
                type: 'dotted'
              }
            },
            boundaryGap: false,
            data: ['周一', '周二', '周三', '周四', '周五', '周六', '周日']
          }
        ],
        yAxis: [
          {
            type: 'value'
          }
        ],
        series: []
      }
      //  基于准备好的dom,初始化echarts实例
      var myChart = echarts.init(document.getElementById('main1'))
      //  使用刚指定的配置项和数据显示图表。
      myChart.setOption(option)

      //  增加一条折线数据
      option.legend.data.push('搜索引擎')
      option.series.push({
        name: '搜索引擎', //  系列名称
        type: 'line', //  图表类型,折线图line、散点图scatter、柱状图bar、饼图pie、雷达图radar
        stack: '总量',
        areaStyle: {
          // 有这个参数则改曲线区域有背景颜色
          normal: {
            color: '#6B7CFF' // 改变区域颜色
          }
        },
        data: [820, 932, 901, 934, 1290, 1330, 1320]
      })
      option.legend.data.push('win')
      option.series.push({
        name: 'win', //  系列名称
        type: 'line', //  图表类型,折线图line、散点图scatter、柱状图bar、饼图pie、雷达图radar
        data: [112, 23, 45, 56, 233, 343, 454, 89, 343, 123, 45, 123]
      })
      myChart.setOption(option)
    }
① chartLineBox 实例图
② main1 示例图

