Matlab中为图添加标题和轴标签
目录
创建简单的线图
添加标题
添加坐标轴标签
添加图例
更改字体大小
带有变量值的标题
此示例说明如何使用 title、xlabel 和 ylabel 函数向图中添加标题和轴标签。它还说明如何通过更改字体大小来自定义坐标区文本的外观。
创建简单的线图
创建x,它是 100 个介于 −2π 和 2π 之间的线性间隔值。将 y1 和 y2 创建为 x 的正弦和余弦值。绘制两组数据。
x = linspace(-2*pi,2*pi,100);
y1 = sin(x);
y2 = cos(x);
figure
plot(x,y1,x,y2)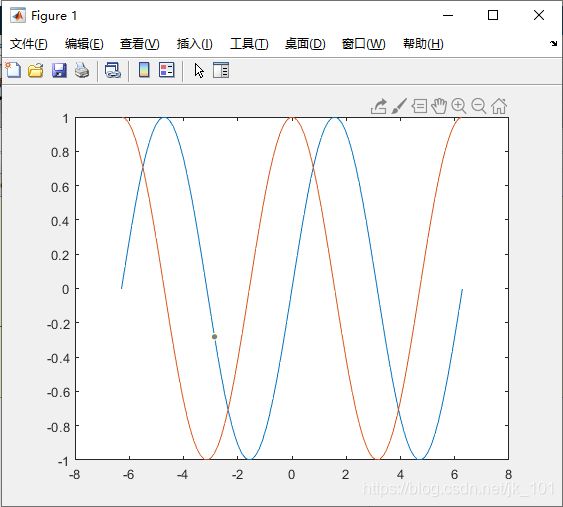
添加标题
使用 title 函数向图中添加标题。要显示希腊符号 π,请使用 TeX 标记 \pi。
x = linspace(-2*pi,2*pi,100);
y1 = sin(x);
y2 = cos(x);
figure
plot(x,y1,x,y2)
title('Line Plot of Sine and Cosine Between -2\pi and 2\pi')
添加坐标轴标签
使用xlabel和ylabel函数向图中添加轴标签。
x = linspace(-2*pi,2*pi,100);
y1 = sin(x);
y2 = cos(x);
figure
plot(x,y1,x,y2)
title('Line Plot of Sine and Cosine Between -2\pi and 2\pi')
xlabel('-2\pi < x < 2\pi')
ylabel('Sine and Cosine Values') 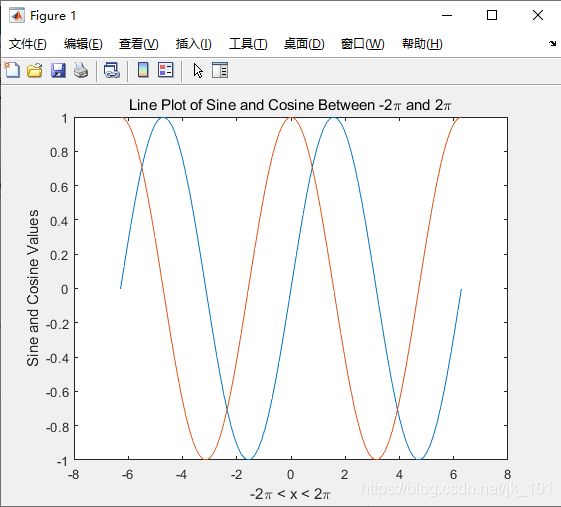
添加图例
使用 legend 函数向图中添加标识每个数据集的图例。按照绘制线条的顺序指定图例说明。(可选)使用八个基本或斜角方位之一指定图例位置,在本例中为 'southwest'。
x = linspace(-2*pi,2*pi,100);
y1 = sin(x);
y2 = cos(x);
figure
plot(x,y1,x,y2)
title('Line Plot of Sine and Cosine Between -2\pi and 2\pi')
xlabel('-2\pi < x < 2\pi')
ylabel('Sine and Cosine Values')
legend({'y = sin(x)','y = cos(x)'},'Location','southwest')
更改字体大小
Axes 对象具有可用来自定义坐标区外观的属性。例如,FontSize 属性控制标题、标签和图例的字体大小。使用 gca 函数访问当前 Axes 对象。然后使用圆点表示法设置 FontSize 属性。
x = linspace(-2*pi,2*pi,100);
y1 = sin(x);
y2 = cos(x);
figure
plot(x,y1,x,y2)
title('Line Plot of Sine and Cosine Between -2\pi and 2\pi')
xlabel('-2\pi < x < 2\pi')
ylabel('Sine and Cosine Values')
legend({'y = sin(x)','y = cos(x)'},'Location','southwest')
ax = gca;
ax.FontSize = 13;
带有变量值的标题
通过使用 num2str 函数将值转换为文本,可在标题文本中包含变量值。可以使用类似的方法为轴标签或图例条目添加变量值。添加带有 sin(π)/2 值的标题。
x = linspace(-2*pi,2*pi,100);
y1 = sin(x);
y2 = cos(x);
figure
plot(x,y1,x,y2)
title('Line Plot of Sine and Cosine Between -2\pi and 2\pi')
xlabel('-2\pi < x < 2\pi')
ylabel('Sine and Cosine Values')
legend({'y = sin(x)','y = cos(x)'},'Location','southwest')
ax = gca;
ax.FontSize = 13;
k = sin(pi/2);
title(['sin(\pi/2) = ' num2str(k)])