react antv/X6可视化工具超详细入门
描述之前我想先吐槽一下这个X6的官网,可能原生html、JS还行,但是要灵活运用到框架上,官网上的react实例是真看不懂,我个人而言,真的很难灵活运用到真实项目中,幸好后面有带佬的代码供参考,不得不说质量雀食高
开整!
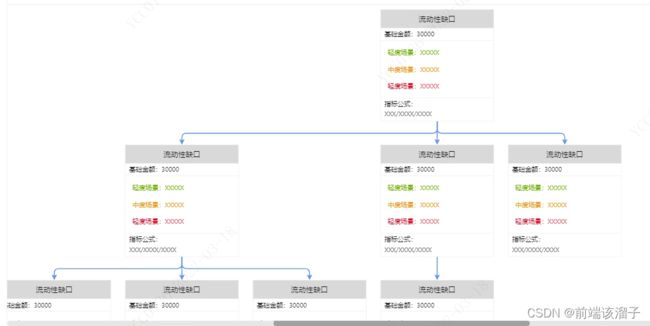
首先我们的目的是画一个这样的图表

看到这个树状图,我们想要搞清楚,我们需要哪几样来完成
 - 不是显示单独一个数据,所以必然要自定义节点
 - 第一先确定数据格式,从后台传过来的数据里面不单是数据,还需要一组头尾的连接字段来确认边,如果已经大致看过X6的可视化逻辑,自然明白边的头尾是什么逻辑了
 - 其次自定义节点,自定义节点需要从创建开始,然后以html的形式画节点,最后注册使用
 - 剩下就是基本的画布背景配置和边的配置
第一步确定数据格式,我用的是这样的:
const data = {
		deptNodes:[{
			id:1,
			deptCode:000,
			deptTitle:'流动性缺口',
			deptAmount:3000,
			light:'XXXXX',
			moderate:'XXXXX',
			severe:'XXXXX',
			bid:null,
			indexInfo:'XXX/XXXX/XXXX'
		},{
			id:2,
			deptCode:000,
			deptTitle:'流动性缺口',
			deptAmount:3000,
			light:'XXXXX',
			moderate:'XXXXX',
			severe:'XXXXX',
			bid: 1,
			indexInfo:'XXX/XXXX/XXXX'
		},{
			id:3,
			deptCode:000,
			deptTitle:'流动性缺口',
			deptAmount:3000,
			light:'XXXXX',
			moderate:'XXXXX',
			severe:'XXXXX',
			bid:1,
			indexInfo:'XXX/XXXX/XXXX'
		},{
			id:4,
			deptCode:000,
			deptTitle:'流动性缺口',
			deptAmount:3000,
			light:'XXXXX',
			moderate:'XXXXX',
			severe:'XXXXX',
			bid:2,
			indexInfo:'XXX/XXXX/XXXX'
		},]
	deptEdges: [
		{
			source:'1',
			target:'2'
		},{
			source:'1',
			target:'3'
		},{
			source:'2',
			target:'4'
		}]
	}
为了节省时间我数据只填了少量,可以看到上面的是数据,下面的是用于边的数据,如果该数据有父级,那么pid的值会是父级的id值
然后我们回到写画布的地方,这个组件里只需要分三步:
传入数据、获取DOM实例,开始渲染
export default function Editor(grahDrawing){
	const grahDrawing = new GrahDrawing()
	const conRef = useRef(null)
	useEffect(()=>{
		//这里是根据条件来注册自定义节点,然后渲染
		if(!registry.exist(RootNodeName)){
			// registerReactComponent为API接口
			Graph.registerReactComponent(RootNodeName, (node)=>{
			return <CustomNode node={node} graphDrawing={graphDrawing} />
		})
		}
		//获取数据并处理
		grahDrawing.loadData(data)
		//这里getDeptGraphConfig方法是画布的配置
		grahDrawing.grash=new Graph(getDeptGraphConfig(conRef.current))
		//渲染画布数据
		grahDrawing.render()
	},[])

	//监听数据,实时更新并渲染
	useEffect(()=>{
		grahDrawing.loadData(data)
		grahDrawing.render()
	},[data])

	return (<div id='container' ref={conRef}></div>)
}
只这么看肯定一头雾水,接下来我们开始分解这三步(这里我省略了很多要引入的东西,请自行补全)
由于这个可视化需要配置的东西比较多,为避免乱七八糟,我分类了几个文件来配置,如果有看不懂的方法,下面都可以找到
先是grahDrawing.loadData(data)
grahDrawing是新建的一个文件,来存放的方法,一切都是围绕他来,接下来看看grahDrawing里都做了些什么
import {Graph,Node} from '@antv/x6'
// 划重点!这个不属于x6内的,要另下包,用来布局
import dagre from 'dagre'

//我的方法和官网的不同,虽然是hooks的开发模式,但是还是用声明类的方法
//也推荐这种,因为比较全面,可观性好
export class DeptDrawing{
	public graph:Graph

	private nodes	//节点
	private edges	//边

	construtor(){
		this.nodes = []
		this.edges = []
	}

	//传入数据然后赋值
	public loadData(data:any){
		let {deptNodes,deptEdges} = data
		this.nodes = deptNodes
		this.edges = deptEdges
	}

	//渲染
	public render(){
		this.graph.fromJSON({
			nodes:this.nodes.map((item:any)=>{
				// 这里的getTreeRootNodeMeta方法是自定义节点的方法,用customMeta 来储存
				let customMeta = getTreeRootNodeMeta()
				return {
					...item,
					...customMeta
				}
			})
		})

		//addEdge是官网API,createEdgeByInfo是另写的,创建边
		this.edges.forEach((v)=>{
			this.graph.addEdge(createEdgeByInfo(v))
		})

		//这一步是用来控制树的布局
		this.layout()
	}

	//下面就是纯ctrl c v了,基本无差错,除了宽高需要自行调整
	//下面用到的方法都是官网API
	public layout(){
		const dir = 'TB'
		const nodes = this.graph.getNodes()
		const edges = this.graph.getEdges()

		const g = new dagre.grahlib.Graph()
		g.setGraph({rankdir:dir, nodesep:30, ranksep:50})
		g.setDefaultEdgeLabel(()=>({}))

		const width = 246
		const height = 243
		nodes.forEach((node)=>{
			g.setNode(node.id, {width, height})
		})
		edges.forEach((edge)=>{
			const source = edge.getSource() as any
			const target = edge.getTarget() as any
			g.setEdge(source.cell, target.cell)
		})
		dagre.layout(g)

		this.graph.freeze()
		g.nodes().forEach((id)=>{
			const node = this.graph.getCellById(id) as Node
			if(node){
				const pos = g.node(id)
				node.position(pos.x, pos.y)
			}
		})

		edges.forEach((dege)=>{
			const source = edge.getSourceNode()!
			const target = edge.getTargetNode()!
			const sourceBBox = source.getBBox()
			const targetBBox = target.getBBox()
			if(sourceBBox .x !== targetBBox .x){
				const gap = targetBBox.y - sourceBBox.y - sourceBBox.height
				const fix = sourceBBox.height
				const y = sourceBBox.y + fix + gap / 2

				edge.setVertices([
					{x:sourceBBox.center.x, y}
					{x:targetBBox.center.x, y}
				])
			}else{
				edge.setVertices([])
			}
		})
		this.graph.unfreeze()
		this.graph.centerContent()
	}

	//这里是一个缩放画布的功能,可根据具体业务来添加
	public zoomGraph(expand: boolean,factor:number = 0.1){
		if(expand){
			this.graph.zoom(factor)
		}else{
			this.graph.zoom(-factor)
		}
	}
}
我给他们各分了一个文件来写,首先是画布、节点和边的配置
//这个引入的就是上面代码的文件
import {DeptDrawing} from './drawing'

export const deptDrawing = new DeptDrawing()

//画布配置
export const getDeptGraphConfig = (container)=>{
	return {
		container,
		width: 1300,
		height: 487,
		autoResize: true,
		interactiong: false,
		mousewheel: {
			enabled: true,
			modifiers: 'ctrl',
			factor: 1.1,
			maxScale: 2,
			minScale: 0.5
		},
		sorting: 'approx' as any,
		selecting: false,
		Keyboard: {
			enabled: true,
			global: true
		},
		history: true,
		background: {
			color:'#fff' //画布背景色
		},
		grid: {
			size: 5, //网格大小 5px
			visible: true //是否渲染网格背景
		},
		scroller: {
			enabled: true,
			pannable: true,
			maxWidth: 1741 //画布最大宽度
		}
	}
}

//获取节点的可视化配置信息
export const getNodeMeta = ()=>{
	return {
		shape: 'tree-node',
		width: 246,
		height: 243
	}
}

//边的配置信息
export const TreeEdgeInfo = {
	router: {name:'manhattan'},
	connector: {name:'rounded'},
	attrs: {
		line:{
			stroke:'#5b8ff9',
			targetMarker:'classic'
		}
	}
}
然后是自定义的节点和边
import {Shape} from '@antv/x6'

//定义节点和边的别名
//这里其实不定义也可以,直接写后面的字符串,如果需要自定义的节点和边比较多的话,推荐写,重要是为了区分他们
export const RootNodeName = 'root-node'
export const TreeEdge = 'tree-edge'

//自定义节点
//这里暂时不是组件,得先创建有这么一个区域,可以理解为给他一个车位
export function getTreeRootNodeMeta(){
	return {
		shape: 'react-shape',
		component: RootNodeName,
		width: 246,
		height: 243
	}
}

// 创建自己的边
export const createEdgeByInfo = ({target, source, id}:any)=>{
	return new Shape.Edge({
		id,
		target,
		source,
		shape:TreeEdge,
		...TreeEdgeInfo	//这里就是刚写的边的配置信息
	})
}
好了,现在该有的配置都写好了,最后写我们的自定义节点组件
import {DeptDrawing} from './drawing'
import React,{ReactElement} from 'react'

export defalut function CustomNode({deptDrawing,node}):ReactElement{
	// 具体打印node,你就能找到你需要渲染的数据
	return <div>
			自定义节点内容
		</div>
}
大功告成!
剩下自由发挥(如果有报错,要么是没下载完包,要么是没import完全)