第二十二章 解读pycocotools的API,目标检测mAP的计算&COCO的评价指标(工具)
Pycocotools介绍
为使用户更好地使用 COCO数据集, COCO 提供了各种 API。COCO是一个大型的图像数据集,用于目标检测、分割、人的关键点检测、素材分割和标题生成。这个包提供了Matlab、Python和luaapi,这些api有助于在COCO中加载、解析和可视化注释。
coco api地址: https://github.com/cocodataset/cocoapi
安装pycocotools 两种方式都可以试试
# for linux and windows
pip install pycocotools
# for windows
pip install git+https://github.com/philferriere/cocoapi.git#subdirectory=PythonAPI
python-pycocotools
核心文件 coco.py cocoeval.py mask.py 这三个文件
coco.py
该文件定义了以下 API:
#这个文件实现了访问 COCO 数据集的接口.可以进行 COCO 标注信息的加载, 解析和可视化操作.
class COCO: # 用于加载 COCO 标注文件并准备所需的数据结构.
      def createIndex()       #创建索引
      def info()              #打印标注文件信息
      def getAnnIds()         #获取满足条件的标注信息ids
      def Catids()            #获取满足条件的类别ids
      def getImgids()         #获取满足条件的图片的 ids
      def loadAnns()          #加载指定 ids 对应的标注信息
      def loadCats()          #加载指定 ids 对应的类别
      def loadImgs()          #加载指定 ids 对应的图片
      def showAnns()          #打印制定标注信息
      def loadRes()           #加载算法的结果并创建可用于访问数据的 API
      def annToMask()         #将 segmentation 标注信息转换为二值 mask
      def download()          #下载图像
      def loadNumpyAnnotations() #加载numpy格式数据
      def annToRLE()          # polygons格式转换
在给定的 API 中, “ann”=annotation, “cat”=category, and “img”=image
COCO 类的构造函数负责加载 json 文件, 并将其中的标注信息建立关联关系.
关联关系存在于以下两个变量中:
- imgToAnns: 将图片 id 和标注信息 关联;
- catToImgs: 将类别 id 和图片 id 关联.
这样做的好处就是: 对于给定的图片 id, 就可以快速找到其所有的标注信息; 对于给定的类别 id, 就可以快速找到属于该类的所有图片.
class COCO:
    def __init__(self, annotation_file=None):
        """
        构造函数, 用来读取关联标注信息.
        :param annotation_file (str): 标注文件路径名
        :return:
        """
        # 加载数据集

        # 定义数据成员
        self.dataset, self.anns, self.cats, self.imgs = dict(),dict(),dict(),dict()
        self.imgToAnns, self.catToImgs = defaultdict(list), defaultdict(list)

        # 加载标注信息
        if not annotation_file == None:
            print('loading annotations into memory...')
            tic = time.time()
            dataset = json.load(open(annotation_file, 'r'))
            # dataset 的类型为 dict
            assert type(dataset)==dict, 'annotation file format {} not supported'.format(type(dataset))
            print('Done (t={:0.2f}s)'.format(time.time()- tic))
            self.dataset = dataset
            self.createIndex()

    def createIndex(self):
        """
        创建索引, 属于构造函数的一部分.
        """
        # create index
        print('creating index...')

        anns, cats, imgs = {}, {}, {}
        # imgToAnns: 将图片 id 和标注信息 关联; 给定图片 id, 就可以找到其所有的标注信息
        # catToImgs: 将类别 id 和图片 id 关联; 给定类别 id, 就可以找到属于这类的所有图片
        imgToAnns,catToImgs = defaultdict(list),defaultdict(list)

        if 'annotations' in self.dataset:
            for ann in self.dataset['annotations']:
                imgToAnns[ann['image_id']].append(ann)
                anns[ann['id']] = ann

        if 'images' in self.dataset:
            for img in self.dataset['images']:
                imgs[img['id']] = img

        if 'categories' in self.dataset:
            for cat in self.dataset['categories']:
                cats[cat['id']] = cat

        if 'annotations' in self.dataset and 'categories' in self.dataset:
            for ann in self.dataset['annotations']:
                catToImgs[ann['category_id']].append(ann['image_id'])
        print('index created!!!')

        # 给几个类成员赋值
        self.anns = anns
        self.imgs = imgs
        self.cats = cats
        self.imgToAnns = imgToAnns
        self.catToImgs = catToImgs
理解数据关联关系的重点是对 imgToAnns 变量类型的理解. 其中, imgToAnns 的类型为: defaultdict(
{ 289343: [
            {'id': 1768, 'area': 702.1057499999998,
             'segmentation': [[510.66, ... 510.45, 423.01]],
             'bbox': [473.07, 395.93, 38.65, 28.67],
             'category_id': 18,
             'iscrowd': 0,
             'image_id': 289343
            },
            ...
        ]
}
getAnnIds() - 获取标注信息的 ids
 def getAnnIds(self, imgIds=[], catIds=[], areaRng=[], iscrowd=None):
   """
   获取满足给定条件的标注信息 id. 如果未指定条件, 则返回整个数据集上的标注信息 id
   :param imgIds  (int 数组)     : 通过图片 ids 指定
           catIds  (int 数组)     : 通过类别 ids 指定
           areaRng (float 数组)   : 通过面积大小的范围, 2 个元素. (e.g. [0 inf]) 指定
           iscrowd (boolean)      : get anns for given crowd label (False or True)
   :return: ids (int 数组)       : 满足条件的标注信息的 ids
   """
   imgIds = imgIds if _isArrayLike(imgIds) else [imgIds]
   catIds = catIds if _isArrayLike(catIds) else [catIds]

   if len(imgIds) == len(catIds) == len(areaRng) == 0:
       anns = self.dataset['annotations']
   else:
       if not len(imgIds) == 0:
           lists = [self.imgToAnns[imgId] for imgId in imgIds if imgId in self.imgToAnns]
           anns = list(itertools.chain.from_iterable(lists))
       else:
           anns = self.dataset['annotations']

       anns = anns if len(catIds)  == 0
		       else [ann for ann in anns if ann['category_id'] in catIds]
       anns = anns if len(areaRng) == 0
		       else [ann for ann in anns
			       if ann['area'] > areaRng[0] and ann['area'] < areaRng[1]]

   if not iscrowd == None:
       ids = [ann['id'] for ann in anns if ann['iscrowd'] == iscrowd]
   else:
       ids = [ann['id'] for ann in anns]

   return ids
showAnns() - 显示给定的标注信息
def showAnns(self, anns):
    """
    显示给定的标注信息. 一般在这个函数调用之前, 已经调用过图像显示函数: plt.imshow()
    :param anns (object 数组): 要显示的标注信息
    :return: None
    """
    if len(anns) == 0:
        return 0
    if 'segmentation' in anns[0] or 'keypoints' in anns[0]:
        datasetType = 'instances'
    elif 'caption' in anns[0]:
        datasetType = 'captions'
    else:
        raise Exception('datasetType not supported')

    # 目标检测的标注数据
    if datasetType == 'instances':
        ax = plt.gca()
        ax.set_autoscale_on(False)
        polygons = []
        color = []
        for ann in anns:
            # 为每个标注 mask 生成一个随机颜色
            c = (np.random.random((1, 3))*0.6+0.4).tolist()[0]
            # 边界 mask 标注信息
            if 'segmentation' in ann:
                if type(ann['segmentation']) == list:
                    # polygon
                    for seg in ann['segmentation']:
                        # 每个点是多边形的角点, 用 (x, y) 表示
                        poly = np.array(seg).reshape((int(len(seg)/2), 2))
                        polygons.append(Polygon(poly))
                        color.append(c)
                else:
                    # mask
                    t = self.imgs[ann['image_id']]
                    if type(ann['segmentation']['counts']) == list:
                        rle = maskUtils.frPyObjects([ann['segmentation']], t['height'], t['width'])
                    else:
                        rle = [ann['segmentation']]
                    m = maskUtils.decode(rle)
                    img = np.ones( (m.shape[0], m.shape[1], 3) )
                    if ann['iscrowd'] == 1:
                        color_mask = np.array([2.0,166.0,101.0])/255
                    if ann['iscrowd'] == 0:
                        color_mask = np.random.random((1, 3)).tolist()[0]
                    for i in range(3):
                        img[:,:,i] = color_mask[i]
                    ax.imshow(np.dstack( (img, m*0.5) ))
             # 人体关节点 keypoints 标注信息
            if 'keypoints' in ann and type(ann['keypoints']) == list:
                # turn skeleton into zero-based index
                sks = np.array(self.loadCats(ann['category_id'])[0]['skeleton'])-1
                kp = np.array(ann['keypoints'])
                x = kp[0::3]
                y = kp[1::3]
                v = kp[2::3]
                for sk in sks:
                    if np.all(v[sk]>0):
                        plt.plot(x[sk],y[sk], linewidth=3, color=c)
                plt.plot(x[v>0], y[v>0],'o',markersize=8, markerfacecolor=c, markeredgecolor='k',markeredgewidth=2)
                plt.plot(x[v>1], y[v>1],'o',markersize=8, markerfacecolor=c, markeredgecolor=c, markeredgewidth=2)
        p = PatchCollection(polygons, facecolor=color, linewidths=0, alpha=0.4)
        ax.add_collection(p)
        p = PatchCollection(polygons, facecolor='none', edgecolors=color, linewidths=2)
        ax.add_collection(p)
    elif datasetType == 'captions':
        for ann in anns:
            print(ann['caption'])
读取数据进行可视化
from pycocotools.coco import COCO
import numpy as np
from skimage import io  # scikit-learn 包
import matplotlib.pyplot as plt
import pylab
pylab.rcParams['figure.figsize'] = (8.0, 10.0)

#COCO 是一个类, 因此, 使用构造函数创建一个 COCO 对象, 构造函数首先会加载 json 文件,
# 然后解析图片和标注信息的 id, 根据 id 来创建其关联关系.

dataDir='F:/Dataset/COCO/val2017/val2017'
dataType='val2017'
annFile='F:/Dataset/COCO/val2017/stuff_annotations_trainval2017/stuff_{}.json'.format(dataType)
# 初始化标注数据的 COCO api
coco=COCO(annFile)
print("数据加载成功!")

#显示 COCO 数据集中的具体类和超类
cats = coco.loadCats(coco.getCatIds())
nms = [cat['name'] for cat in cats]
print('COCO categories: \n{}\n'.format(' '.join(nms)))
print("类别总数为: %d" % len(nms))
nms = set([cat['supercategory'] for cat in cats])
print('COCO supercategories: \n{}'.format(' '.join(nms)))
print("超类总数为:%d " % len(nms))


#加载并显示指定 图片 id
catIds = coco.getCatIds(catNms=['person','dog','skateboard']);
imgIds = coco.getImgIds(catIds=catIds );
imgIds = coco.getImgIds(imgIds = [324158])
img = coco.loadImgs(imgIds[np.random.randint(0,len(imgIds))])[0]
I = io.imread(img['coco_url'])
plt.axis('off')
plt.imshow(I)
plt.show()

#加载并将 “segmentation” 标注信息显示在图片上
# 加载并显示标注信息
plt.imshow(I)
plt.axis('off')
annIds = coco.getAnnIds(imgIds=img['id'], catIds=catIds, iscrowd=None)
anns = coco.loadAnns(annIds)
coco.showAnns(anns)
mAP计算
mAP是目标检测中常用的评价标准,尤其是在COCO数据集中,可以看到不同的mAP的评价指标,本文对这一系列指标做详细的解读:
首先,要引入四个概念:
- TP(True positive): IOU>0.5的检测框个数(注意:每个GT box只能计算一次)
- TN(True negative) : IOU <= 0.5,没有被检测到,GT也没有标注的数量。也就是本来是负样例,分类也是负样例。(本文map计算没有用到该指标)。
- FP(False positive): IOU <= 0.5的检测框的个数(或是检测到同一个GT box的多余检测框的数量)
- FN(False negative):没有检测到的GT box的数量
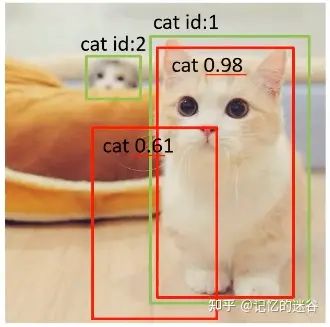
举个例子,上图有两只猫,绿色的框分别代表两个GT box真实框,红色的代表预测框。比较大的红框因为大于0.5的IOU阈值,所以是TP,比较小的红框因为值小于0.5,所以是FP。另外右下角的小猫没有被检测到,属于漏检,也就是FN。
(注意:【图中的0.9和0.3代表类别的置信度,不是IOU】,如果不理解IOU的话,可以移步至《IOU、GIOU、DIOU、CIOU损失函数详解》,有详细描述)
再来介绍两个评价指标:
1.Precision(查准率):TP/(TP + FP),代表模型预测的所有目标中,预测正确目标的占比。
如图,一张图有5只猫,但是我们只有一个阈值大于0.5的红框,也就是TP = 1,因为没有其他阈值小于0.5的框,所以FP=0. Pricision = 1 /(1+0) = 1 ,也就是100%查准率。但是能说这个网络的效果很好吗?显然不能,因为其他四只猫都没有被识别出来,因此就引入了查全率。
Recall(查全率): TP/(TP+FN),代表所有真实目标中,模型预测正确目标的比例。
我们再看这张图:图中有5只猫,但是有很多红色框框出现在图中。首先看TP:5个GT box都有红框正确预测到(虽然IOU>0.5的红框不止一个,但每个GT box只算一次),再看FN:图中没有漏检的物体,所以FP = 0 。Recall = 5/(5+0) = 1 ,也就是100%的查全率,但图中乱七八糟的杂框显然效果不好,简单通过Recall率,来评价检测质量也不合理。
所以,我们又引入了两个指标:
- AP: precision - Recall 曲线的面积
- mAP:各类别AP的平均值
举一个例子具体算IOU和mAP:
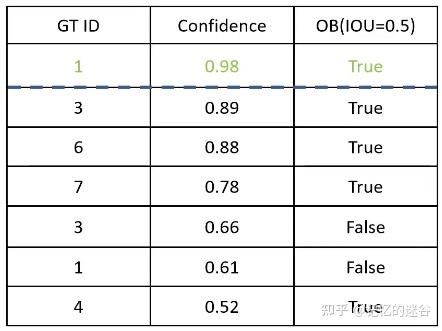
如上图,有两只猫,每只猫分别有一个绿色的GT box,两个红色的box代表预测框。因为有两个目标,所以设置num_obj = 2。接下来,我们用表格描述图中预测框的信息:表格有两行数据,按照第二列类别置信度(0.98和0.61降序排序),第一列代表属于哪个实例,第三列代表IOU是否大于0.5(注意哦,不是图片里面的0.98和0.61的置信度,这里用的是IOU评价指标,如果你不清楚的话,不妨花点时间看一下《IOU、GIOU、DIOU、CIOU损失函数详解》)。
接下来,我们再输入一张图片,包括一个目标,所以num_obj=2+1 = 3,图中又包含两个红色预测框,我们把它按照类别置信度排序,继续加入表格:
图中两个预测框都属于第三个实例,所以GT ID=3,中间红框的IOU>0.5所以为True,右边的红框IOU小于0.5所以是False。
我们输入第三张图片:图片中包括四个绿色的GT box框(ID分别为4~7),有三个红色的预测框,其中id为5的猫猫没有对应的预测框。
最左边的红框类别置信度(0.52)最低,加入表格的最后一行。ID为6和7的猫猫对应预测框也分别加入表格中。因为这三个框IOU都大于0.5,所以都设置为True
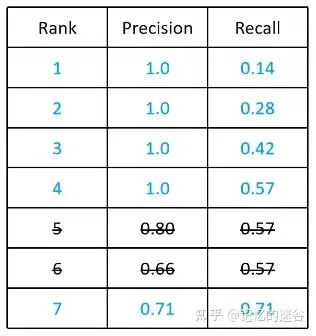
我们从以下几种不同的指标(方法同VOC2010)分别计算Precision和Recall:
1.假设confidence >= 0.9才算正确匹配,观察表格,只有第一行满足匹配条件,因此TP = 1, FP = 0(根据匹配条件,只检测到一个图片,而且是正确的,所以不存在误检),FN=6(7个目标,找出来1个,漏检6个)。 Precision = 1 / (1+0) = 1,Recall = 1 /(1 + 6) = 0.14 。
2.假设conficende >= 0.89算是正确匹配,观察表格,前两行满足条件,TP=2, FP=0, FN=5, Precision = 2/(2+0) = 1。 Recall = 2 / (2+5) = 0.28。
以此类推,假设confidence >= 0.5是正确匹配,所有的行都满足条件,此时TP = 5, FP = 2,FN = 2(ID为2和5的猫漏检)。Precision = 5/(5+2) = 0.71。 Recall = 5 / (5+2) = 0.71。
将上述的步骤计算出的Precision和Recall列成上表所示。对于横坐标Recall而言,需要滤除重复信息,也就是对下图的0.57的Recall有三行,只保留Precision最大的一行,其他两行不计算。
将上图的5个点绘图,图中的阴影部分的面积就是上面说的AP。具体计算如下:AP=(0.14-0)*1 + (0.28-0.14)*1+(0.42-0.28)*1 + (0.57-0.42)*1 +(0.71-0.57)*0.71 = 0.67。所以猫这个类别的AP就是0.67,同样,把所有类别的AP值计算出来,取平均,我们就得到了mAP.
附:precision和recall计算源码
# 计算每个类别的precision和recall
def calc_recall_precision(gt_list, pred_list):
    bin_gt = np.array(gt_list, dtype=np.bool)  # gt的标签,如果包含该类别,则类别为True,否则为False
    arr_pred = np.array(pred_list, dtype=np.float)  # 预测类别的置信度
    p_list = pred_list
    p_list.sort()
    recall_list = []
    precision_list = []
    threshold_list = []
    for i in range(201):  # 阈值从0到1,以0.05为区间间隔,计算每个区间的准召率
        score_base = i * 0.005  # 当前阈值
        bin_pred = arr_pred >= float(score_base)  # 是否大于阈值
        tp = np.sum(bin_pred & bin_gt)  # 大于阈值且是正确类别
        tn = np.sum((~bin_pred) & (~bin_gt))
        fp = np.sum(bin_pred & (~bin_gt))  # 置信度大于阈值但预测类别错误
        fn = np.sum((~bin_pred) & (bin_gt))  # 是真实类别但置信度小于阈值没检测到
        p = (tp + 0.0) / (tp + fp + 0.000001)  # precision = tp /(tp + fp)代表预测正确的类别占比。
        r = (tp + 0.0) / (tp + fn + 0.000001)  # recall = tp / (tp + fn) 代表查全率
        if (tp+fp)<1 or (tp+fn)<1:
            continue
        recall_list.append(r)
        precision_list.append(p)
        threshold_list.append(score_base)

    # reverse是反转列表,对于recall来说是变成升序序列,precision和threshold变成降序序列
    recall_list.reverse()  # [0.28 0.30, 0.42, 0.46,.....]
    precision_list.reverse()  # [0.99, 0.98, 0.96, ......]
    threshold_list.reverse()  # [0.81, 0.80, 0.75, ......]
    return recall_list, precision_list, threshold_list

# 计算所有类别的平均precision和recall
def cal_average_class_pr(pred, target):  # 两个参数的shape:[batch_size, num_classes]
    pre_sum, rec_sum, count = 0,0,0  # 初始化precision和recall的值
    for i in range(len(target[0])):  # 循环次数等价于类别个数
        pred_list = pred[:, i]
        gt_list = target[:, i]
        pred_list.tolist()
        gt_list.tolist()
        rec, prec, thresh = calc_recall_precision(gt_list, pred_list)
        rec = np.asarray(rec, dtype=np.float32)
        prec = np.asarray(prec, dtype=np.float32)
        thresh = np.asarray(thresh, dtype=np.float32)
        idx = np.where(rec>0.8)  # 查全率大于0.8的索引
        if len(idx[0].tolist())>0:
            # 找到recall首次大于0.8的索引,输出当前索引对应的reccall,precision,threshold
            rec_v = rec[idx[0][0]]
            prec_v = prec[idx[0][0]]
            thresh_v = thresh[idx[0][0]]
            print("Class: {}, prec: {:.4f}, rec: {:.4f}, thresh: {:.4}".format(i+1, prec_v, rec_v, thresh_v))
            pre_sum = pre_sum + prec_v
            rec_sum = rec_sum + rec_v
            count = count + 1
    return pre_sum/count, rec_sum/count
COCO评价指标
API介绍
首先看第一部分的AP:
AP代表 IOU从0.5到0.95,间隔0.05计算一次mAP, 取平均mAP即为最终结果。
AP0.5和AP0.75则分别代表IOU为0.5和0.75的mAP值
第二部分 : AP Across Scales:
代表小、中、大三个类别的mAP,将面积小于322像素点的归为小目标,面积大于962的归为大目标,介于二者之间的为中等目标。计算不同目标的mAP。
第三部分:AR
代表查全率。三组分别代表每张图片限定检测1、10、100个目标能够得到相应的Recall的值。
第四部分:AR Across Scales
代表对应不同尺度的Recall值。
初步实现目标检测任务mAP计算
首先要弄清楚cocoapi指定的数据格式(训练网络预测的结果),在官网的Evaluate下拉框中选择Results Format,可以看到每种任务的指定数据格式要求。
![]() 这里主要讲讲针对目标检测的格式。根据官方文档给的预测结果格式可以看到,我们需要以列表的形式保存结果,列表中的每个元素对应一个检测目标(每个元素都是字典类型),每个目标记录了四个信息:
这里主要讲讲针对目标检测的格式。根据官方文档给的预测结果格式可以看到,我们需要以列表的形式保存结果,列表中的每个元素对应一个检测目标(每个元素都是字典类型),每个目标记录了四个信息:
image_id记录该目标所属图像的id(int类型)category_id记录预测该目标的类别索引,注意这里索引是对应stuff中91个类别的索引信息(int类型)bbox记录预测该目标的边界框信息,注意对应目标的[xmin, ymin, width, height] (list[float]类型)score记录预测该目标的概率(float类型)
下图是训练在coco2017验证集上预测的结果:
![]()
接着将预测结果保存成json文件,后面需要使用到:
import json

results = []  # 所有预测的结果都保存在该list中
# write predict results into json file
json_str = json.dumps(results, indent=4)
with open('predict_results.json', 'w') as json_file:
    json_file.write(json_str)
数据准备:
- COCO2017验证集json文件
instances_val2017.json
链接: https://pan.baidu.com/s/1ArWe8Igt_q0iJG6FCcH8mg 密码: sa0j
示例代码:
from pycocotools.coco import COCO
from pycocotools.cocoeval import COCOeval


# accumulate predictions from all images
# 载入coco2017验证集标注文件
coco_true = COCO(annotation_file="/data/coco2017/annotations/instances_val2017.json")
# 载入网络在coco2017验证集上预测的结果
coco_pre = coco_true.loadRes('predict_results.json')

coco_evaluator = COCOeval(cocoGt=coco_true, cocoDt=coco_pre, iouType="bbox")
coco_evaluator.evaluate()
coco_evaluator.accumulate()
coco_evaluator.summarize()
输出结果:
loading annotations into memory...
Done (t=0.43s)
creating index...
index created!
Loading and preparing results...
DONE (t=0.65s)
creating index...
index created!
Running per image evaluation...
Evaluate annotation type *bbox*
DONE (t=21.15s).
Accumulating evaluation results...
DONE (t=2.88s).
 Average Precision  (AP) @[ IoU=0.50:0.95 | area=   all | maxDets=100 ] = 0.233
 Average Precision  (AP) @[ IoU=0.50      | area=   all | maxDets=100 ] = 0.415
 Average Precision  (AP) @[ IoU=0.75      | area=   all | maxDets=100 ] = 0.233
 Average Precision  (AP) @[ IoU=0.50:0.95 | area= small | maxDets=100 ] = 0.104
 Average Precision  (AP) @[ IoU=0.50:0.95 | area=medium | maxDets=100 ] = 0.262
 Average Precision  (AP) @[ IoU=0.50:0.95 | area= large | maxDets=100 ] = 0.323
 Average Recall     (AR) @[ IoU=0.50:0.95 | area=   all | maxDets=  1 ] = 0.216
 Average Recall     (AR) @[ IoU=0.50:0.95 | area=   all | maxDets= 10 ] = 0.319
 Average Recall     (AR) @[ IoU=0.50:0.95 | area=   all | maxDets=100 ] = 0.327
 Average Recall     (AR) @[ IoU=0.50:0.95 | area= small | maxDets=100 ] = 0.145
 Average Recall     (AR) @[ IoU=0.50:0.95 | area=medium | maxDets=100 ] = 0.361
 Average Recall     (AR) @[ IoU=0.50:0.95 | area= large | maxDets=100 ] = 0.463
一个具体实现的例子
mAP(Mean Average Precision)均值平均准确率,即检测多个目标类别的平均准确率。在目标检测领域mAP是一个最为常用的指标。具体概念不叙述,本文主要讲如何利用Github上一些开源项目计算自己网络的mAP值等信息。首先给出两个Github链接,链接1;链接2。这两个链接项目都可以帮助我们计算mAP的值,用法也差不多,链接1感觉用起来更简单点,链接2的功能更全面点(绘制的Precision-Recall曲线更准)。本文主要介绍下链接项目1的使用方法,利用项目1最终能得到如下图所示的计算结果(虽然也能绘制P-R曲线,但感觉绘制的不准确)。
![]()
![]()
项目的使用流程
使用方法流程主要分为如下几步:(1) 克隆项目代码;(2)创建ground-truth文件,并将文件复制到克隆项目的 input/ground-truth/ 文件夹中;(3)创建detection-results文件,并将文件复制到克隆项目的 input/detection-results/ 文件夹中;(4)将与detection-results对应的验证图像文件放入克隆项目 input/images-optional 文件夹中(该步骤为可选项,可以不放入图像,如果放入图像会将标注框、检测框都绘制在图像上,方便后期分析结果);(5)在项目文件夹中打开终端,并执行指令python main.py即可得到结果(结果全部保存在克隆项目的results文件夹中)。
1)克隆代码
打开项目1https://github.com/Cartucho/mAP进行克隆,或者直接使用git克隆。
2)创建ground-truth文件
在项目的readme中有给出事例:
例如图像1中的标注信息(image_1.txt),文件的命名要与图像命名相同,每一行的参数为类别名称、左上角x坐标、左上角y坐标、右下角x坐标、右下角y坐标
<class_name> <left> <top> <right> <bottom> [<difficult>]
参数difficult是可选项,每一个图像文件对应生成一个txt文件,与PASCAL VOC的xml文件一样,一一对应。
tvmonitor 2 10 173 238
book 439 157 556 241
book 437 246 518 351 difficult
pottedplant 272 190 316 259
将所有生成好的文件复制到克隆项目的 input/ground-truth/ 文件夹中
3)创建detection-results文件
同样在项目的readme中有给出事例:
对于图像1的实际预测信息(image_1.txt),文件的命名要与图像命名相同,每一行的参数为类别名称、预测概率、预测左上角x坐标、预测左上角y坐标、预测右下角x坐标、预测右下角y坐标
<class_name> <confidence> <left> <top> <right> <bottom>
每个预测图像对应生成一个txt文件
tvmonitor 0.471781 0 13 174 244
cup 0.414941 274 226 301 265
book 0.460851 429 219 528 247
chair 0.292345 0 199 88 436
book 0.269833 433 260 506 336
将所有生成好的预测文件复制到克隆项目的 input/detection-results/ 文件夹中
4)复制图像文件(可选)
将与detection-results对应的验证图像文件放入克隆项目 input/images-optional 文件夹中(该步骤为可选项,可以不放入图像,如果放入图像会将标注框、检测框都绘制在图像上,方便后期分析结果)
5)开始计算
在项目文件夹中打开终端,并执行指令python main.py即可得到结果(结果全部保存在克隆项目的results文件夹中,注:该项目的计算结果是IOU阈值取0.5的结果)
通过以上步骤就能够得到出训练网络的预测mAP,使用起来也是非常的简单。对于需要绘制Precision-Recall曲线的同学可以使用**链接2**中的项目代码。项目2的使用步骤其实基本相同,且需要准备的文件也都是一样的,不同的是使用的指令。
cup 0.414941 274 226 301 265
book 0.460851 429 219 528 247
chair 0.292345 0 199 88 436
book 0.269833 433 260 506 336
将所有生成好的预测文件复制到克隆项目的 input/detection-results/ 文件夹中

#### 4)复制图像文件(可选)

将与detection-results对应的验证图像文件放入克隆项目 input/images-optional 文件夹中(该步骤为可选项,可以不放入图像,如果放入图像会将标注框、检测框都绘制在图像上,方便后期分析结果)

#### 5)开始计算

在项目文件夹中打开终端,并执行指令python main.py即可得到结果(结果全部保存在克隆项目的results文件夹中,**注:该项目的计算结果是IOU阈值取0.5的结果**)


通过以上步骤就能够得到出训练网络的预测mAP,使用起来也是非常的简单。对于需要绘制Precision-Recall曲线的同学可以使用**[链接2](https://github.com/rafaelpadilla/Object-Detection-Metrics)**中的项目代码。项目2的使用步骤其实基本相同,且需要准备的文件也都是一样的,不同的是使用的指令。


