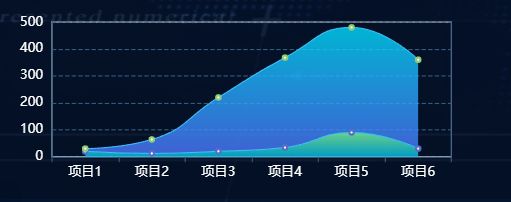
echarts 通用线性渐变堆叠面积图
getLineData2() {
const myChart = echarts.init(this.$refs.chartDom);
const option = {
tooltip: {
trigger: 'axis',
},
legend: {
show: false,
textStyle: {
fontSize: 14,
color: '#ffffff',
},
data: ['AAA', 'BBB'],
},
grid: {
show: true,
left: '10%',
top: '15%',
right: '10%',
bottom: '13%',
},
xAxis: {
data: ['项目1', '项目2', '项目3', '项目4', '项目5', '项目6'],
axisLabel: {
textStyle: {
color: '#ffffff',
},
},
axisLine: {
show: true,
lineStyle: {
color: '#335B7E',
},
},
},
yAxis: [
{
type: 'value',
splitLine: {
show: true,
lineStyle: {
type: 'dashed',
color: '#335B7E',
},
},
axisLabel: {
textStyle: {
color: '#ffffff',
},
},
axisLine: {
show: true,
lineStyle: {
color: '#335B7E',
},
},
},
{
type: 'value',
splitLine: {
show: false,
},
axisLabel: {
formatter: '{value} %',
textStyle: {
color: '#ffffff',
},
},
axisLine: {
show: true,
lineStyle: {
color: '#335B7E',
},
},
},
],
series: [
{
name: 'AAA',
type: 'line',
smooth: true,
stack: 'Total',
lineStyle: {
width: 1,
color: '#39BFFA',
},
areaStyle: {
opacity: 0.8,
color: new echarts.graphic.LinearGradient(0, 0, 0, 1, [
{
offset: 0,
color: 'rgb(128, 255, 165)',
},
{
offset: 1,
color: 'rgb(1, 191, 236)',
},
]),
},
emphasis: {
focus: 'series',
},
data: [20, 12, 20, 34, 90, 30],
},
{
name: 'BBB',
type: 'line',
stack: 'Total',
lineStyle: {
width: 1,
color: '#39BFFA',
},
smooth: true,
areaStyle: {
opacity: 0.8,
color: new echarts.graphic.LinearGradient(0, 0, 0, 1, [
{
offset: 0,
color: 'rgb(0, 221, 255)',
},
{
offset: 1,
color: 'rgb(77, 119, 255)',
},
]),
},
emphasis: {
focus: 'series',
},
data: [10, 52, 200, 334, 390, 330],
},
],
};
myChart.setOption(option);
window.addEventListener('resize', function () {
myChart.resize();
});
},