vue使用echarts中国地图
需求:Vue3 + vite +TS 项目内使用 Echarts 5 绘制中国地图。鼠标悬浮省份上面显示指定的数据,地图支持缩放和拖拽的功能,页面放大缩小支持自适应,window.addEventListener(‘resize’, resize); 添加防抖动函数debounce。

一、安装 Echarts
npm install echarts --save
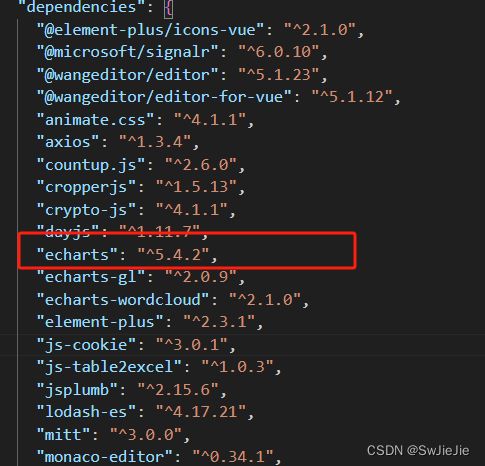
安装成功后如下:
二、下载地图的 json 数据
免费的文件下载地址:
http://datav.aliyun.com/portal/school/atlas/area_selector#&lat=30.332329214580188&lng=106.72278672066881&zoom=3.5

三、具体代码如下
1,chinaMap.vue组件如下:
<template>
<div class="leftCard">
<div id="chinaMap" ref="chinaMap"></div>
</div>
</template>
<script setup lang="ts" name="ChinaMap">
import { reactive, onMounted, onBeforeUnmount, nextTick, ref, watch } from 'vue';
import * as echarts from 'echarts';
import china from "./china.json"; //中国地图
import { debounce } from 'lodash-es';
const chinaMap = ref()
var myChart = {} as any
const resize = debounce(() => myChart && myChart.resize(), 200)
const props = defineProps({
areadataInfo: {
type: Array,
default: () => []
}
});
const state = reactive({
MapDataList: [
{
name: "黑龙江省",
value: 44,
randomCount: 80,
relCenterCount: '80/1092',
relDoctorCount: '80/1223',
perf: "1%",
rank: ''
},
{
name: "湖南省",
value: 23,
randomCount: 100,
relCenterCount: '100/1092',
relDoctorCount: '100/1223',
perf: "70%",
rank: 'Top2'
},
{
name: "云南省",
value: 88,
randomCount: 180,
relCenterCount: '187/1092',
relDoctorCount: '190/1223',
perf: "80%",
rank: 'Top1'
},
{
name: "安徽省",
value: 66,
randomCount: 90,
relCenterCount: '157/1092',
relDoctorCount: '188/1223',
perf: "60%",
rank: 'Top3'
},
{
name: "新疆维吾尔自治区",
value: 166,
randomCount: 90,
relCenterCount: '157/1092',
relDoctorCount: '188/1223',
perf: "60%",
rank: 'Top001'
},
{
name: "内蒙古自治区",
value: 106,
randomCount: 90,
relCenterCount: '157/1092',
relDoctorCount: '188/1223',
perf: "60%",
rank: 'Top002'
}
] as any
});
watch(
() => props.areadataInfo,
(newProps) => {
if (newProps) {
state.MapDataList = newProps
nextTick(() => {
initEchartMap();
});
}
},
{ immediate: true, deep: true }
);
const emit = defineEmits(['MaphospitalRecommend']);
onMounted (() => {
window.addEventListener('resize', resize);
})
onBeforeUnmount(() => {
window.removeEventListener('resize', resize);
})
// 初始化地图
function initEchartMap(){
echarts.registerMap('china', china) //这个特别重要
if (myChart != null && myChart != "" && myChart != undefined) {
echarts.dispose(chinaMap.value)
}
myChart = echarts.init(chinaMap.value);
myChart.off('click');
//echart 配制option
var options= {
tooltip: { // 鼠标移到图里面的浮动提示框
// formatter详细配置: https://echarts.baidu.com/option.html#tooltip.formatter
formatter(params, ticket, callback) {
// params.data 就是series配置项中的data数据遍历
let patienticfVal, randomCount, relCenterCount, relDoctorCount, areaName, rank
if (params.data) {
patienticfVal = params.data.icfCount;
randomCount = params.data.randomCount;
relCenterCount = params.data.relCenterCount;
relDoctorCount = params.data.relDoctorCount;
areaName = params.data.areaName;
rank = 'Top' + params.data.rank;
} else {// 为了防止没有定义数据的时候报错写的
patienticfVal = 0;
randomCount = 0;
relCenterCount = 0;
relDoctorCount = 0;
rank = '';
}
let htmlStr = ` ${areaName ? areaName : params.name} ${rank}
患者ICF数:
${patienticfVal}
患者入组数:${randomCount}
覆盖医院:${relCenterCount}
覆盖医生:${relDoctorCount}
`;
return htmlStr;
},
backgroundColor: "#ff7f50", //提示标签背景颜色
textStyle: { color: "#fff" }, //提示标签字体颜色
padding: [5, 10, 0, 10], // 设置上下的内边距为 5,0,左右的内边距为 10
},
visualMap: {
show: true,
bottom: 20,
left: 50,
// left: 50, top: '30%', right: 0, bottom: 0, //定位的左上角以及右下角分别所对应的经纬度
text: ['高', '低'],
min: 0,
itemHeight: 200, //图形的高度,即长条的高度。
color: [
'#ee6666',//红色
'#fc8452',//橙色
'#fac858',//黄色
'#9a60b4',//紫色
'#ea7ccc',//淡紫
'#3ba272',//绿色
'#91cc75',//浅绿
'#5470c6',//蓝色
'#5283e7',//淡蓝
]
},
geo: { // 地理坐标系组件用于地图的绘制// geo配置详解: https://echarts.baidu.com/option.html#geo
map: "china", // 表示中国地图
roam: true, // 是否开启鼠标缩放和平移漫游
// roam : 'scale',
scaleLimit: { //滚轮缩放的极限控制
min: 1,
max: 12
},
zoom: 1.2, // 当前视角的缩放比例(地图的放大比例)
label: {
show: false
},
itemStyle: {
normal: {
areaColor: "#d5e8f3",
borderColor: "#fcfdfe",
borderWidth: 1,
},
emphasis: {
areaColor: "#aaa",
},
},
// emphasis: { // 地图区域的多边形 图形样式。
// borderColoer: "#ffffff",//未选中的状态
// areaColor: "#D8E9FD", //背景颜色
// label: {
// show: true, //显示名称
// },
// itemStyle: { //选中的状态// 高亮状态下的多边形和标签样式
// shadowBlur: 20,
// shadowColor: "rgba(0, 0, 0, 0.5)",
// borderColoer: "#fff",
// areaColor: "#DA3A3A"
// }
// }
},
series: [
{
name: "地图", // 浮动框的标题(上面的formatter自定义了提示框数据,所以这里可不写)
type: "map",
geoIndex: 0,
label: {
show: true,
},
// 这是需要配置地图上的某个地区的数据,根据后台的返回的数据进行拼接(下面是我定义的假数据)
data: state.MapDataList,
}
]
}
myChart.clear();
myChart.setOption(options);
// window.addEventListener('resize', () => {
// if (myChart) {
// myChart.resize();
// }
// });
// myChart.resize();
//地图的点击事件 ,钻取到市我就不举例了,类似的方法,点击事件可以获取到当前点击的省份的数据;
myChart.on('click', function(params) {
// console.log(params, '---点击地图---')
emit('MaphospitalRecommend', params);
})
// myChart.on('mouseover', function(params) {
// console.log(params, '---鼠标移入---')
// })
// myChart.on('mouseout', function(params) {
// console.log(params, '---鼠标移出---')
// })
}
</script>
<style scoped lang="scss">
.leftCard{
width: 100%;
height: 100%;
#chinaMap{
width: 100%;
height: 600px;
}
}
</style>
