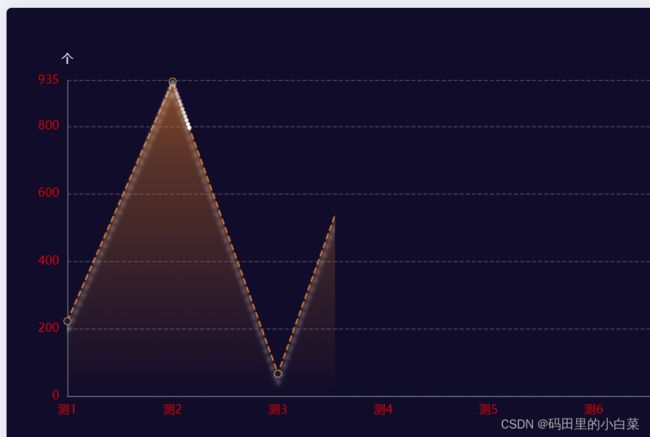
echarts折线图的线呈现动态效果
效果如图
let yData = [222, 932, 66, 934, 111, 333, 0],
  xData = ["测1", "测2", "测3", "测4", "测5", "测6", "测7"],
   datacoords = [
     {
       coords: [],
     },
   ];
 for (var i = 0; i < xData.length; i++) {
   datacoords[0].coords.push([xData[i], yData[i]]);
 }

option = {

   animationDuration: 3000,
   animationEasing: "bounceOut", //缓动动画
   animationThreshold: 8, //动画元素的阈值
   tooltip: {
     trigger: "axis",
     backgroundColor: "rgba(0,0,0,.5)",
     axisPointer: {
       type: "cross",
       label: {
         backgroundColor: "rgba(0,0,0,.5)",
       },
     },
     textStyle: {
       color: "#fff",
       fontSize: 14,
     },
   },
   grid: {
     left: "3%", //图表距边框的距离
     right: "3%",
     top: "15%",
     bottom: "5%",
     containLabel: true,
   },
   xAxis: [
     {
       nameGap: 3,
       nameTextStyle: {
         color: "rgba(255,255,255,.8)",
         fontSize: 12,
       },
       type: "category",
       data: xData,
       boundaryGap: false, //从0开始
       axisLine: {
         onZero: true,
         rotate: 30, //坐标轴内容过长旋转
         interval: 1,
         lineStyle: {
           color: "#636E7C",
         },
       },
       axisLabel: {
         color: "red", //坐标的字体颜色
         fontSize: 12,
       },
       axisTick: {
         //坐标轴刻度颜色  x和y不交叉
         show: false,
       },
     },
   ],
   yAxis: [
     {
       name: "个",
       min: 0,
       max: function (value) {
         return Math.ceil(value.max / 5) * 5;
       },
       splitNumber: 5,
       type: "value",
       nameTextStyle: {
         color: "rgba(255,255,255,.89)",
         fontSize: 12,
       },
       splitLine: {
         show: true,
         lineStyle: {
           color: "rgba(255,255,255,.25)",
           type: "dashed",
         },
       },
       axisTick: {
         //坐标轴刻度颜色
         show: false,
       },
       axisLine: {
         //坐标轴线颜色
         show: true,
         lineStyle: {
           color: "#636E7C",
         },
       },
       axisLabel: {
         color: "red", //坐标的字体颜色
         fontSize: 12,
       },
     },
   ],
   series: [
     {
       name: "",
       type: "line",
       smooth: false,
       lineStyle: {
         color: "#DC7828",
         width: 1.5,
         type: "dashed",
         shadowOffsetX: 0, // 折线的X偏移
         shadowOffsetY: 10, // 折线的Y偏移
         shadowBlur: 4, // 折线模糊
         shadowColor: "rgba(255, 255, 255, 0.8)", //设置折线阴影颜色
       },
       showSymbol: true, //是否默认展示圆点
       symbol: "circle", // 默认是空心圆(中间是白色的)
       symbolSize: 7,
       itemStyle: {
         color: "#021E47", //实圆的背景色
         borderWidth: 1,
         borderColor: "#DC7828",
       },
       areaStyle: {
         color: new echarts.graphic.LinearGradient(0, 1, 0, 0, [
           {
             offset: 1,
             color: "rgba(220,120,40,0.8)",
           },
           {
             offset: 0.74,
             color: "rgba(220,120,40,0.5)",
           },
           {
             offset: 0,
             color: "rgba(220,120,40,0)",
           },
         ]),
       },
       emphasis: {
         focus: "series",
       },
       data: yData,
     },
     {
       showSymbol: false,
       name: "",
       type: "lines",
       polyline: true,
       smooth: false,
       coordinateSystem: "cartesian2d",
       zlevel: 1,
       effect: {
         show: true,
         smooth: true,
         period: 6,
         symbolSize: 4,
       },
       lineStyle: {
         color: "#fff",
         width: 1,
         opacity: 0,
         curveness: 0,
         cap: "round",
       },
       data: datacoords,
     },
   ],
};