ELK----日志分析
ELK相关知识
ELK的概念与组件
ELK平台是一套完整的日志集中处理解决方案,将 ElasticSearch、Logstash 和 Kiabana 三个开源工具配合使用, 完成更强大的用户对日志的查询、排序、统计需求。

E:ElasticSearch (ES)
ES是一个开源的,分布式的存储检索引擎(索引型的非关系型数据库)。
java代码开发的。基于Lucene结构开发的一套全文检索引擎。拥有一个web接口。用户可以通过浏览器的方式和ES组件进行通信。
作用:存储日志。允许全文搜索,结构化搜索(索引点),索引点可以支持大容量的日志数据。也可以搜索其他不同类型的文档
L:Logstash
数据收集引擎,可以支持动态的(实时)从各种服务应用,手机日志资源,还可以对收集到的日志数据进行过滤,分析,丰富,统一格式等操作。然后把数据同步到ES存储引擎。
RUBY语言编写的,运行在java虚拟机上的一个强大的处理工具。数据传输,格式化处理,格式化输出。
作用:处理日志
过滤模块是logstash的核心功能。
K:Kiabana 图形化界面。
可以更好的分析存储在ES上的日志数据。提供一个图形化界面,来浏览ES上的日志数据。汇总分析,搜索。
工作流程图:

elk的作用
当我们管理一个大集群时,需要分析和定位的日志就会很多,每一台服务器分别去分析,将会耗时耗力,所以我们应运而生了一个集中的统一的日志管理和分析系统。极大的提高了定位问题的效率。
日志系统的特征
1.收集,可以收集基本上市面上常用的软件日志
2.传输:收集到的日志需要发送到ES上
3.存储:ES负责存储数据
4.UI:图形化界面(Kiabana)
其他的数据收集工具
filebeat 轻量级开源的日志收集工具。收集的速度比较快,没有数据分离和过滤的能力,一般是结合logstash结合使用
kafka 中间件消息队列
RabbitMQ 中间件消息队列
实验部署
| ES1 | 192.168.233.30 |
| ES2 | 192.168.233.20 |
| Logstash kibana | 192.168.233.10 |
java -version
yum -y install java
安装必须要有epel源

test2,test3都要装es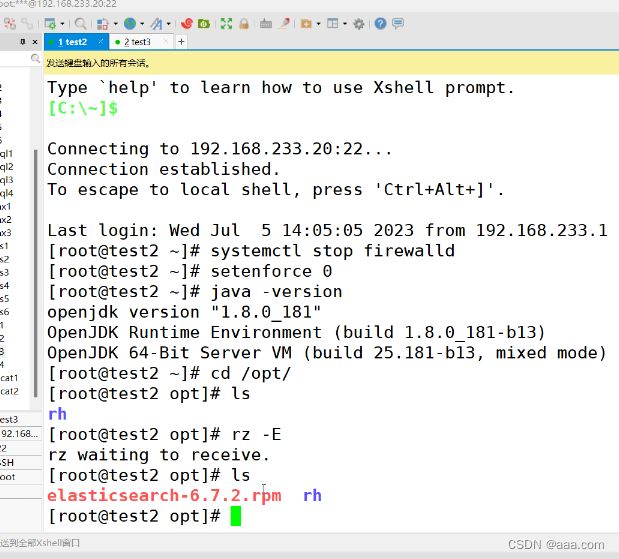
test2 , test3
rpm -ivh elasticsearch-6.7.2.rpm
//rpm安装

cd /etc/elasticsearch
ls
cp elssticsearch.yml elasticsearch.yml.bak

vim elasticsearch.yml
test2:
cluster.name:  my-elk-cluster
任意名字 ,但空格要保留

node.name: node1
node.master: true
node.data: true

test3:
node.name: node2
node.master: false
node.data: true

line33
path.data: /opt/log

bootstrap.memory_lock: true    注释掉
禁止es使用交换分区
line 55
network.host: 0.0.0.0
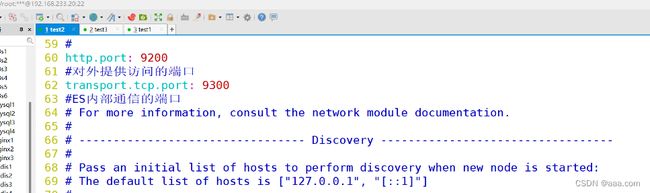
http.port: 9200
对外提供访问的端口
transport.tcp.port" 9300
ES内部通信的端口
discovery.zen.ping.unicast.host:["192.168.233.20:9300","192.168.233.30:9300"]
test3的检测

test2 的检测

test1,2,3
systemctl enable elasticsearch.service

netstat -antp | grep 9200
查看端口来看服务是否启动
test1,2,3
systemctl enable elasticsearch.service
netstat -antp | grep 9200
查看端口来看服务是否启动

安装 Elasticsearch-head 插件
Elasticsearch 在 5.0 版本后,Elasticsearch-head 插件需要作为独立服务进行安装,
需要使用npm工具(NodeJS的包管理工具)安装。
安装 Elasticsearch-head 需要提前安装好依赖软件 node 和 phantomjs。
node:是一个基于 Chrome V8 引擎的 JavaScript 运行环境。
phantomjs:是一个基于 webkit 的JavaScriptAPI,可以理解为一个隐形的浏览器,
任何基于 webkit 浏览器做的事情,它都可以做到。
(1)编译安装 node
#上传软件包 node-v8.2.1.tar.gz 到/opt
yum install gcc gcc-c++ make -y

cd /opt
tar zxvf node-v8.2.1.tar.gz

cd node-v8.2.1/
./configure
make && make install

(2)安装 phantomjs
#上传软件包 phantomjs-2.1.1-linux-x86_64.tar.bz2 到
cd /opt
tar jxvf phantomjs-2.1.1-linux-x86_64.tar.bz2
cd /opt/phantomjs-2.1.1-linux-x86_64/bin
cp phantomjs /usr/local/bin

(3)安装 Elasticsearch-head 数据可视化工具
#上传软件包 elasticsearch-head-master.zip 到/opt
cd /opt
unzip elasticsearch-head-master.zip
cd elasticsearch-head-master/
npm install		 //安装依赖包

#速度慢,可以指定为淘宝镜像
npm config set registry http://registry.npm.taobao.org/

#再次安装
npm install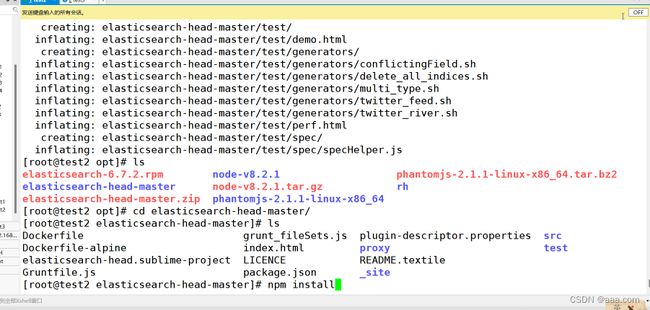
修改 Elasticsearch 主配置文件
(4)修改 Elasticsearch 主配置文件
vim /etc/elasticsearch/elasticsearch.yml
......
--末尾添加以下内容--
http.cors.enabled: true				#开启跨域访问支持,默认为 false
http.cors.allow-origin: "*"			#指定跨域访问允许的域名地址为所有

systemctl restart elasticsearch

(5)启动 elasticsearch-head 服务
#必须在解压后的 elasticsearch-head 目录下启动服务,进程会读取该目录下的 gruntfile.js 文件,否则可能启动失败。
cd /opt/elasticsearch-head-master
npm run start &

> [email protected] start /opt/elasticsearch-head-master
> grunt server

Running "connect:server" (connect) task
Waiting forever...
Started connect web server on http://localhost:9100

#elasticsearch-head 监听的端口是 9100
netstat -natp |grep 9100

(6)通过 Elasticsearch-head 查看 Elasticsearch 信息
通过浏览器访问 http://192.168.233.12:9100/ 地址并连接群集。如果看到群集健康值为 green 绿色,代表群集很健康。

(7)插入索引
#通过命令插入一个测试索引,索引为 index-demo,类型为 test。
curl -X PUT 'localhost:9200/index-demo/test/1?pretty&pretty' -H 'content-Type: application/json' -d '{"user":"zhangsan","mesg":"hello world"}'
//输出结果如下:
{
"_index" : "index-demo",
"_type" : "test",
"_id" : "1",
"_version" : 1,
"result" : "created",
"_shards" : {
"total" : 2,
"successful" : 2,
"failed" : 0
},
"created" : true
}

curl -X DELETE 'localhost:9200/index-demo/test/1?pretty&pretty' -H 'content-Type: application/json' -d '{"user":"zhangsan","mesg":"hello world"}'

浏览器访问 http://192.168.233.12:9100/ 查看索引信息,可以看见索引默认被分片5个,并且有一个副本。
点击“数据浏览”,会发现在node1上创建的索引为 index-demo,类型为 test 的相关信息。
Elasticsearch 的可视化工具中,以索引分区(Shard)为单位,
可能采用不同的标识颜色来表示它们的状态。黑色的边框通常表示主分片(Primary Shard)。
在 Elasticsearch 中,索引被分成多个分区,这些分区称为分片。
每个索引可能包含一个或多个主分片以及它们的副本。主分片是数据的主要存储,
副本用于提高冗余和可用性。
ELK Logstash 部署(在 Apache 节点上操作)
Logstash 一般部署在需要监控其日志的服务器。在本案例中,Logstash 部署在 Apache 服务器上,
用于收集 Apache 服务器的日志信息并发送到 Elasticsearch。
安装Apahce服务(httpd)
yum -y install httpd
systemctl start httpd
安装Java环境
yum -y install java
java -version
安装logstash
#上传软件包 logstash-6.7.2.rpm 到/opt目录下
cd /opt
rpm -ivh logstash-6.7.2.rpm
systemctl start logstash.service
systemctl enable logstash.service


ln -s /usr/share/logstash/bin/logstash /usr/local/bin/

#可以指定logstash的工作目录,默认为:/etc/logstash/conf.d
path.config: /opt/log
测试 Logstash
Logstash 命令常用选项:
- -f:通过这个选项可以指定 Logstash 的配置文件,根据配置文件配置 Logstash 的输入和输出流。
- -e:从命令行中获取,输入、输出后面跟着字符串,
- 该字符串可以被当作 Logstash 的配置(如果是空,则默认使用 stdin 作为输入,stdout 作为输出)。
- -t:测试配置文件是否正确,然后退出。
定义输入和输出流:
#输入采用标准输入,输出采用标准输出(类似管道),新版本默认使用 rubydebug 格式输出
logstash -e 'input { stdin{} } output { stdout{} }'
#使用 rubydebug 输出详细格式显示,codec 为一种编解码器
logstash -e 'input { stdin{} } output { stdout{ codec=>rubydebug } }'
Ruby 调试信息使用 rubydebug 格式进行输出,显示了事件的各个字段和元数据。
......
www.baidu.com										#键入内容(标准输入)
{
    "@timestamp" => 2020-12-22T02:15:39.136Z,		#输出结果(标准输出处理后的结果)
      "@version" => "1",
          "host" => "apache",
       "message" => "www.baidu.com"
}

#使用 Logstash 将信息写入 Elasticsearch 中
logstash -e 'input { stdin{} } output { elasticsearch { hosts=>["192.168.233.12:9200","192.168.233.13:9200"] } }'
			 输入				输出			对接
......
www.baidu.com										#键入内容(标准输入)
www.sina.com.cn										#键入内容(标准输入)
www.google.com										#键入内容(标准输入)

//结果不在标准输出显示,而是发送至 Elasticsearch 中,可浏览器访问 http://192.168.233.12:9100/ 查看索引信息和数据浏览。

定义 logstash配置文件
Logstash 配置文件基本由三部分组成:input、output 以及 filter(可选,根据需要选择使用)。
●input:表示从数据源采集数据,常见的数据源如Kafka、日志文件等
file beats kafka redis stdin
●filter:表示数据处理层,包括对数据进行格式化处理、数据类型转换、数据过滤等,支持正则表达式
grok 对若干个大文本字段进行再分割成一些小字段 (?<字段名>正则表达式) 字段名: 正则表达式匹配到的内容
date 对数据中的时间格式进行统一和格式化
mutate 对一些无用的字段进行剔除,或增加字段
mutiline 对多行数据进行统一编排,多行合并或拆分
●output:表示将Logstash收集的数据经由过滤器处理之后输出到Elasticsearch。
elasticsearch stdout
格式如下:
#在每个部分中,也可以指定多个访问方式。例如,若要指定两个日志来源文件,则格式如下:
input {
	file { path =>"/var/log/messages" type =>"syslog"}
	file { path =>"/var/log/httpd/access.log" type =>"apache"}
}

#可以指定logstash的工作目录,默认为:/etc/logstash/conf.d
path.config: /opt/log

#修改 Logstash 配置文件,让其收集系统日志/var/log/messages,并将其输出到 elasticsearch 中。
chmod +r /var/log/messages					#让 Logstash 可以读取日志

cd /etc/logstash/conf.d/
vim system.conf

vim /etc/logstash/conf.d/system.conf
input {
    file{
        path =>"/var/log/messages"						        #指定要收集的日志的位置
        type =>"system"									        #自定义日志类型标识
        start_position =>"beginning"					        #表示从开始处收集,另外一个是end.
    }
}
output {
    elasticsearch {										        #输出到 elasticsearch
        hosts => ["192.168.233.12:9200","192.168.233.13:9200"]	#指定 elasticsearch 服务器的地址和端口
        index =>"system-%{+YYYY.MM.dd}"					        #指定输出到 elasticsearch 的索引格式
    }
}

logstash -f system.conf --path.data /opt/test1 &


浏览器访问 http://192.168.233.20:9100/ 查看索引信息
bana 部署(在 Node1 节点上操作)
安装 Kiabana
#上传软件包 kibana-6.7.2-x86_64.rpm 到/opt目录
cd /opt
rpm -ivh kibana-6.7.2-x86_64.rpm

2.设置 Kibana 的主配置文件
vim /etc/kibana/kibana.yml
--2--取消注释,Kiabana 服务的默认监听端口为5601
server.port: 5601

--7--取消注释,设置 Kiabana 的监听地址,0.0.0.0代表所有地址
server.host: "0.0.0.0"

--28--取消注释,配置es服务器的ip,如果是集群则配置该集群中master节点的ip
elasticsearch.url:  ["http://192.168.80.12:9200","http://192.168.80.13:9200"]

--37--取消注释,设置在 elasticsearch 中添加.kibana索引
kibana.index: ".kibana"

--96--取消注释,配置kibana的日志文件路径(需手动创建),不然默认是messages里记录日志
logging.dest: /var/log/kibana.log

--113--修改为中文模式
i18n.locale: "zh-CN"

3.创建日志文件,启动 Kibana 服务
touch /var/log/kibana.log
chown kibana:kibana /var/log/kibana.log

systemctl start kibana.service
systemctl enable kibana.service

netstat -natp | grep 5601

4.验证 Kibana
浏览器访问 http://192.168.233.11:5601
第一次登录需要添加一个 Elasticsearch 索引:
Management -> Index Pattern -> Create index pattern
Index pattern 输入:system-*	#在索引名中输入之前配置的 Output 前缀“system”

Next step -> Time Filter field name 选择 @timestamp -> Create index pattern

单击 “Discover” 按钮可查看图表信息及日志信息。
数据展示可以分类显示,在“Available Fields”中的“host”,然后单击 “add”按钮,可以看到按照“host”筛选后的结果

5.将 Apache 服务器的日志(访问的、错误的)添加到 Elasticsearch 并通过 Kibana 显示
vim /etc/logstash/conf.d/apache_log.conf
input {
    file{
        path => "/etc/httpd/logs/access_log"
        type => "access"
        start_position => "beginning"
    }
    file{
        path => "/etc/httpd/logs/error_log"
        type => "error"
        start_position => "beginning"
    }
}
output {
    if [type] == "access" {
        elasticsearch {
            hosts => ["192.168.233.12:9200","192.168.233.13:9200"]
            index => "apache_access-%{+YYYY.MM.dd}"
        }
    }
	if [type] == "error" {
        elasticsearch {
            hosts => ["192.168.233.12:9200","192.168.233.13:9200"]
            index => "apache_error-%{+YYYY.MM.dd}"
        }
    }
}

cd /etc/logstash/conf.d/
/usr/share/logstash/bin/logstash -f apache_log.conf

浏览器访问 http://192.168.80.10:9100 查看索引是否创建

浏览器访问 http://192.168.80.10:5601 登录 Kibana,单击“Index Pattern -> Create Index Pattern”按钮添加索引, 在索引名中输入之前配置的 Output 前缀 apache_access-*,并单击“Create”按钮。在用相同的方法添加 apache_error-*索引。
选择“Discover”选项卡,在中间下拉列表中选择刚添加的 apache_access-* 、apache_error-* 索引, 可以查看相应的图表及日志信息。
扩展--logstash收集nginx的文件
**nginx必须用json格式!!!!
首先配置 nginx.conf。因为他必须是json格式才能运行
Cd /usr/local/nginx/conf

Vim nginx.conf
http {
    include       mime.types;
    default_type  application/octet-stream;

    log_format  main  '$remote_addr - $remote_user [$time_local] "$request" '
                      '$status $body_bytes_sent "$http_referer" '
                      '"$http_user_agent" "$http_x_forwarded_for"';
    log_format  json  '{"@timestamp":"$time_iso8601",'
                      '"host":"$server_addr",'
                      '"clientip":"$remote_addr",'
                      '"size":$body_bytes_sent,'
                      '"responsetime":$request_time,'
                      '"upstreamtime":"$upstream_response_time",'
                      '"upstreamhost":"$upstream_addr",'
                      '"http_host":"$host",'
                      '"url":"$uri",'
                      '"referer":"$http_referer",'
                      '"agent":"$http_user_agent",'
                      '"status":"$status"}';

    access_log  /usr/local/nginx/logs/access.log  json;
***得在http模块输入该配置文件
指定拉取数据的路径
Vim /etc/logstash/logstash.yml
此步骤指定了拉取数据的路径
Cd /opt
Vim system.conf
因此拉取数据的配置文件得和上步路径一致
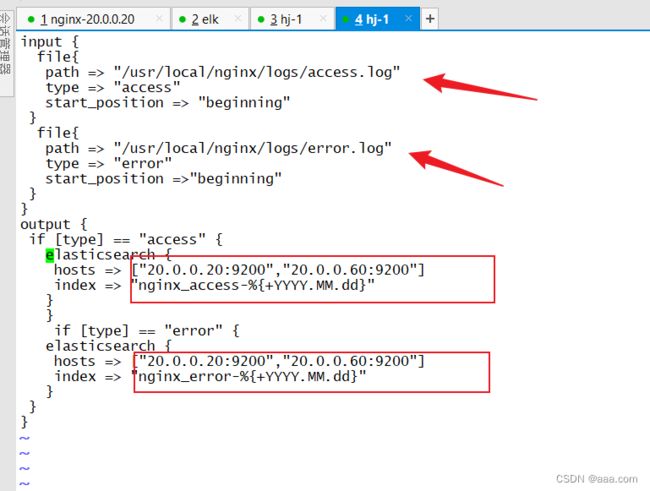
input {
  file{
   path => "/usr/local/nginx/logs/access.log"
   type => "access"
   start_position => "beginning"
 }
  file{
   path => "/usr/local/nginx/logs/error.log"
   type => "error"
   start_position =>"beginning"
 }
}
output {
 if [type] == "access" {
   elasticsearch {
    hosts => ["20.0.0.20:9200","20.0.0.60:9200"]
    index => "nginx_access-%{+YYYY.MM.dd}"
   }
   }
    if [type] == "error" {
   elasticsearch {
    hosts => ["20.0.0.20:9200","20.0.0.60:9200"]
    index => "nginx_error-%{+YYYY.MM.dd}"
   }
 }
}
编写完成后给日志777的权限,最后重新启动
logstash -f system.conf --path.data /opt/test1 &
--path.data 数据工作目录,此处指定
system.conf 拉取数据的配置文件
注意*****
如果进程被占用杀死进程来重启
Ps -elf | grep logstash
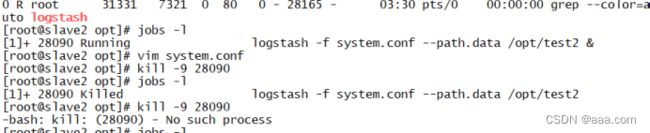
以上是删除方法
重启完毕之后可以进浏览器查看
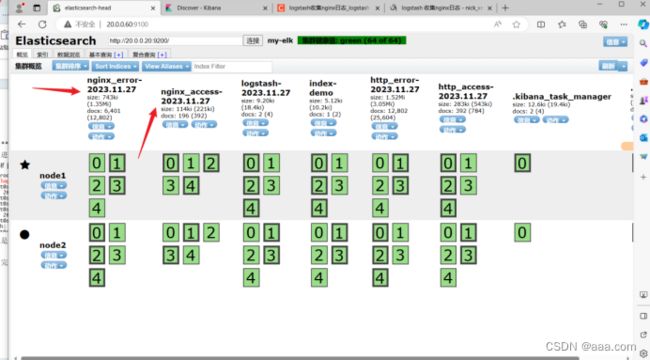
可以发现nginx日志已经更新同步
最后只需要去kibana创建索引方便查看即完成


ES的性能调优
修改打开的最大文件数

针对机器
test1,test2,test3

针对机器
vim /etc/security/limits.conf
* soft nofile 65536
* hard nofile 65536
* soft nproc 32000
* hard nproc 32000
* soft memlock unlimited
* hard memlock unlimited
针对用户
vim /etc/systemd/system.conf
最后一行插入

DefaultLimitNOFILE=65536
一个用户会话的默认最大文件描述符的限制量。
文件描述符:用于标识打开文件或者I/O资源限制的整数

DefaultLimitNPROC=32000
一个用户可以打开的最大进程数量的限制32000.一个用户终端可以打开多少进程

DefaultLimitMEMLOCK=infinity
一个用户的终端默认锁定内存的限制
内核优化:
ES是基于lucence架构,实现的一款索引型数据库。lucence可以利用操作系统的内存来缓存es的索引数据。提供更快的查询速度。在工作中我们会把系统的一半内存留给lucence 机器内存小于64G,50%给ES,50%给操作系统。 如果机器内存大于64G,ES分配4-32G即可,其他的都给操作系统
vim /etc/sysctl.conf
vm.max.map_count=262144
一个进程可以拥有的最大内存映射区参数
内存映射:将文件或者其他设备映射进程地址空间的方法。允许进程直接读取或写入文件,无需常规的I/O方式
映射空间越大,ES和LUCENCE的速度越快
2g/262144
4g/4194304
8g/8388608

sysctl -p
立即生效
总结:
elk:
es:存储数据,索引型数据库
logstash:收集日志信息,然后按照标准化格式发送给es(rubydebug)
k:可视化工具,更人性化显示日志信息,方便用户检索查询