【转载】R语言 如何用ggplot绘制多条折线(附例子)
本文转载自STATOLOGY How to Plot Multiple Lines in ggplot2 (With Example) - Statology
你可以用如下的基本代码在ggplot中绘制多条折线。
ggplot(df, aes(x=x_var, y=y_var)) +
  geom_line(aes(color=group_var)) +
  scale_color_manual(name='legend_title', labels=c('lab1', 'lab2', 'lab3'),
                     values=c('color1', 'color2', 'color3'))
这段代码假定你的dataframe是用long format格式存储的。下面的例子展示了如何使用ggplot绘制多条折线。
假定我们有如下的R dataframe,其中存储了3家不同的商店在5天里的销售数据。
#create data frame
df <- data.frame(day=c(1, 2, 3, 4, 5),
                 storeA=c(5, 6, 8, 8, 9),
                 storeB=c(3, 3, 4, 5, 7),
                 storeC=c(8, 10, 12, 12, 17))

#view data frame
df

  day storeA storeB storeC
1   1      5      3      8
2   2      6      3     10
3   3      8      4     12
4   4      8      5     12
5   5      9      7     17
现在,这个dataframe是以wide format形式存储的。
但是,我们可以用tidyr包里的pivot_longer()函数来快速将数据转为long format形式存储。
library(tidyr)

#convert data from wide to long format
df <- df %>% pivot_longer(cols=c('storeA', 'storeB', 'storeC'),
                          names_to='store',
                          values_to='sales')

#view updated data frame
df

# A tibble: 15 x 3
     day store  sales

 1     1 storeA     5
 2     1 storeB     3
 3     1 storeC     8
 4     2 storeA     6
 5     2 storeB     3
 6     2 storeC    10
 7     3 storeA     8
 8     3 storeB     4
 9     3 storeC    12
10     4 storeA     8
11     4 storeB     5
12     4 storeC    12
13     5 storeA     9
14     5 storeB     7
15     5 storeC    17
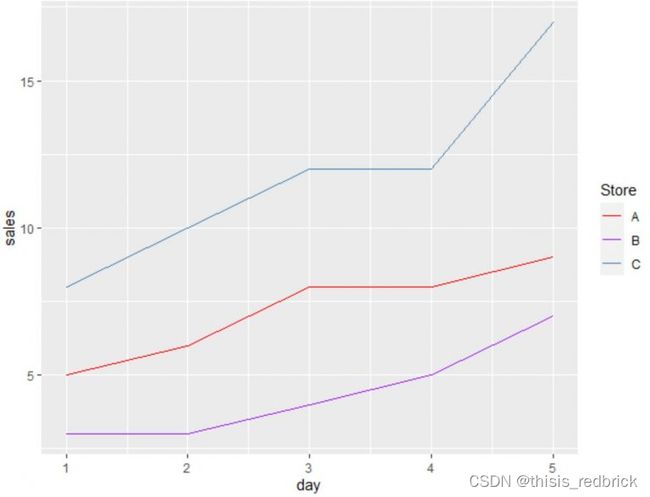
现在,有了以long format 形式存储等dataframe,我们可以用如下代码绘出三条曲线了。
library(ggplot2)

#plot sales by store
ggplot(df, aes(x=day, y=sales)) +
  geom_line(aes(color=store)) +
  scale_color_manual(name='Store', labels=c('A', 'B', 'C'),
                     values=c('red', 'purple', 'steelblue'))
独立的线展现了每间商店在每一天的销售数据。
注意到,我们用scale_color_manual()函数在图的右侧创建了一个图例,以使得折线更容易理解。
你可以自由地改变函数中的参数,按照你的想法创建图例。
扩展链接:
How to Plot Mean and Standard Deviation in ggplot2
How to Add a Horizontal Line to a Plot Using ggplot2
How to Draw a Trend Line in ggplot2
作者是 ZACH
