pyecharts-python的交互可视化库
pyecharts交互可视化库
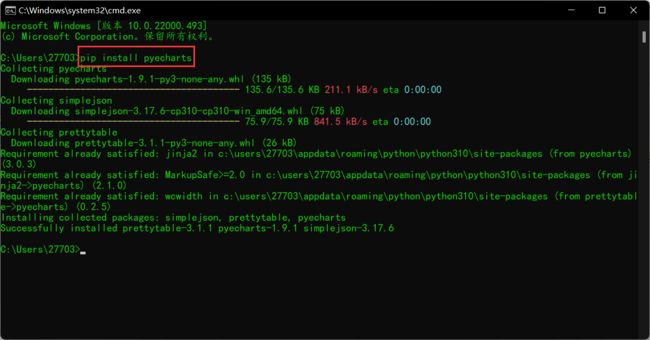
pyecharts库的安装
-
2.anaconda导入pyecharts库
- 官网下载pyecharts · PyPI pyecharts-1.9.1-py3-none-any.whl
- 将文件放于anaconda pkgs文件夹下
- 打开anaconda prompt,进入pkgs文件夹cd /d +文件夹
- 输入pip install pyecharts-1.9.1-py3-none-any.whl 即可
pyecharts使用说明
常见bug:
x轴列表中数据为字符串
一、pyecharts图表类型
| 图表类型 | 说明 |
|---|---|
| 直角坐标系 | 常见的诸如柱状图,折线图等等,这些图表的数据格式都是都是一致的,图表之间也支持相互Ovalap(层叠多图) |
| 地理坐标系 | 地理位置相关的图表,如Map(区域地图),Geo(点地图),BMap(百度地图) |
| 其他图表 | 除了以上两种类型的,还有诸如饼图,漏斗图,日历图等等图表,这类图表之间没有太多的共性,但也会在工作中经常用到 |
# 一次性导入所有的图表
from pyecharts.charts import *
# 也可以只导入需要的图表,如导入柱状图(Bar)和饼图(Pie):
# from pyecharts.charts import Bar, Pie

# 导入所有配置项并重命名为opts
from pyecharts import options as opts
# 也可以依次导入配置项
# from pyecharts.options import ItemStyleOpts
1. 直角坐标系
柱状图,折线图……
直角坐标系的图表在数据格式都是一致的:List类型
1.1 柱状图
from pyecharts.charts import Bar
# 虚假数据
x_data = ['Apple', 'Huawei', 'Xiaomi', 'Oppo', 'Vivo', 'Meizu']
y_data = [123, 153, 89, 107, 98, 23]

# 新建一个Bar实例对象,命名为chart
chart = Bar()
# 为chart添加x轴,y轴的数据
chart.add_xaxis(x_data)
chart.add_yaxis('该系列的标签名', y_data)   #y轴需要添加标签名

# 在notebook中显示图表
# 如果是在Pycharm等IDE中 使用charts.render("xxx.html")
chart.render_notebook()

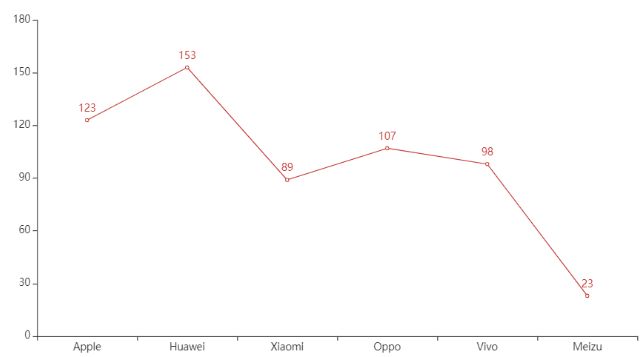
1.2 折线图
from pyecharts.charts import Line
# 创建一个line实例对象
chart = Line()
chart.add_xaxis(x_data)
chart.add_yaxis('',y_data)
chart.render_notebook()
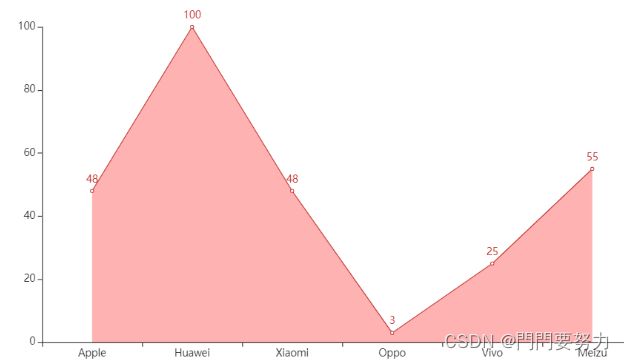
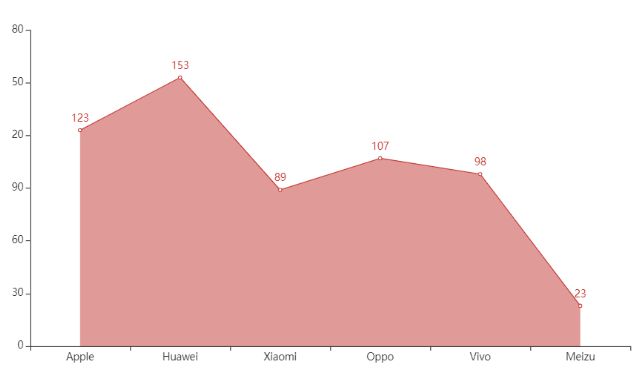
1.3 面积图
面积图在Pyecharts中并没有单独的图表,实现方式就是通过折线图填充区域颜色来实现
from pyecharts.charts import Line
chart = Line()
chart.add_xaxis(x_data)
chart.add_yaxis('', y_data,
    # 区域颜色填充,默认使用系列颜色,透明度设置为0.5
    areastyle_opts=opts.AreaStyleOpts(opacity=0.5)
    )
chart.render_notebook()
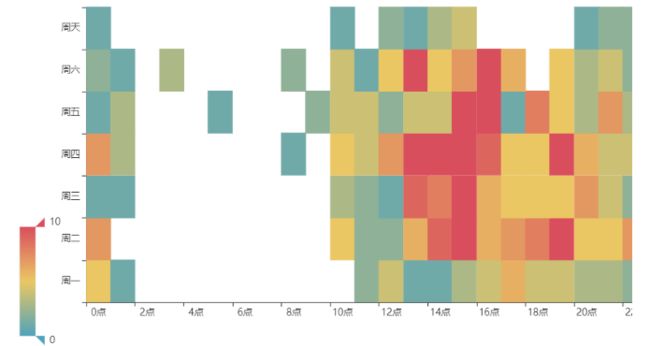
1.4 Heatmap热力图
直角坐标系中的热力图x轴y轴都必须是category类型
from pyecharts.charts import HeatMap
# x轴数据项
hours = ['0点', '1点', '2点', '3点', '4点', '5点', '6点', '7点', '8点', '9点', '10点', '11点', '12点',
         '13点', '14点', '15点', '16点', '17点', '18点', '19点', '20点', '21点', '22点']
# y轴数据项
weekdays = ['周一', '周二', '周三', '周四', '周五', '周六', '周天']
# 单个数据项点值
data = [[0, 0, 5], [1, 0, 1], [2, 0, '-'], [3, 0, '-'], [4, 0, '-'], [5, 0, '-'], [6, 0, '-'], [7, 0, '-'],
        [8, 0, '-'], [9, 0, '-'], [10, 0, '-'], [11, 0, 2], [12, 0, 4], [13, 0, 1], [14, 0, 1], [15, 0, 3],
        [16, 0, 4], [17, 0, 6], [18, 0, 4], [19, 0, 4], [20, 0, 3], [21, 0, 3], [22, 0, 2], [23, 0, 5],
        [0, 1, 7], [1, 1, '-'], [2, 1, '-'], [3, 1, '-'], [4, 1, '-'], [5, 1, '-'], [6, 1, '-'], [7, 1, '-'],
        [8, 1, '-'], [9, 1, '-'], [10, 1, 5], [11, 1, 2], [12, 1, 2], [13, 1, 6], [14, 1, 9], [15, 1, 11],
        [16, 1, 6], [17, 1, 7], [18, 1, 8], [19, 1, 12], [20, 1, 5], [21, 1, 5], [22, 1, 7], [23, 1, 2],
        [0, 2, 1], [1, 2, 1], [2, 2, '-'], [3, 2, '-'], [4, 2, '-'], [5, 2, '-'], [6, 2, '-'], [7, 2, '-'],
        [8, 2, '-'], [9, 2, '-'], [10, 2, 3], [11, 2, 2], [12, 2, 1], [13, 2, 9], [14, 2, 8], [15, 2, 10],
        [16, 2, 6], [17, 2, 5], [18, 2, 5], [19, 2, 5], [20, 2, 7], [21, 2, 4], [22, 2, 2], [23, 2, 4], [0, 3, 7],
        [1, 3, 3], [2, 3, '-'], [3, 3, '-'], [4, 3, '-'], [5, 3, '-'], [6, 3, '-'], [7, 3, '-'], [8, 3, 1], [9, 3, '-'],
        [10, 3, 5], [11, 3, 4], [12, 3, 7], [13, 3, 14], [14, 3, 13], [15, 3, 12], [16, 3, 9], [17, 3, 5], [18, 3, 5],
        [19, 3, 10], [20, 3, 6], [21, 3, 4], [22, 3, 4], [23, 3, 1], [0, 4, 1], [1, 4, 3], [2, 4, '-'], [3, 4, '-'],
        [4, 4, '-'], [5, 4, 1], [6, 4, '-'], [7, 4, '-'], [8, 4, '-'], [9, 4, 2], [10, 4, 4], [11, 4, 4], [12, 4, 2],
        [13, 4, 4], [14, 4, 4], [15, 4, 14], [16, 4, 12], [17, 4, 1], [18, 4, 8], [19, 4, 5], [20, 4, 3], [21, 4, 7],
        [22, 4, 3], [23, 4, '-'], [0, 5, 2], [1, 5, 1], [2, 5, '-'], [3, 5, 3], [4, 5, '-'], [5, 5, '-'], [6, 5, '-'],
        [7, 5, '-'], [8, 5, 2], [9, 5, '-'], [10, 5, 4], [11, 5, 1], [12, 5, 5], [13, 5, 10], [14, 5, 5], [15, 5, 7],
        [16, 5, 11], [17, 5, 6], [18, 5, '-'], [19, 5, 5], [20, 5, 3], [21, 5, 4], [22, 5, 2], [23, 5, '-'], [0, 6, 1],
        [1, 6, '-'], [2, 6, '-'], [3, 6, '-'], [4, 6, '-'], [5, 6, '-'], [6, 6, '-'], [7, 6, '-'], [8, 6, '-'],
        [9, 6, '-'], [10, 6, 1], [11, 6, '-'], [12, 6, 2], [13, 6, 1], [14, 6, 3], [15, 6, 4], [16, 6, '-'],
        [17, 6, '-'], [18, 6, '-'], [19, 6, '-'], [20, 6, 1], [21, 6, 2], [22, 6, 2], [23, 6, 6]]

# 新建heatmap实例
chart = HeatMap()
chart.add_xaxis(hours)
# 添加y轴数据项和数值
chart.add_yaxis("",weekdays,data)

# 全局配置项
chart.set_global_opts(
    # 视觉组件是必须的,需要通过视觉组件的颜色来展示数据大小
    visualmap_opts=opts.VisualMapOpts(max_=10),
)

chart.render_notebook()
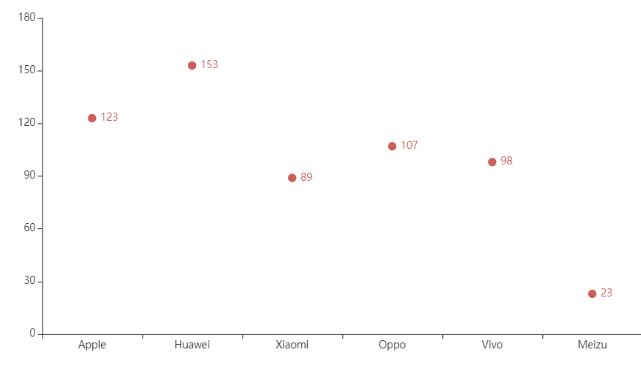
1.5 散点图
# 虚假数据
x_data = ['Apple', 'Huawei', 'Xiaomi', 'Oppo', 'Vivo', 'Meizu']
y_data = [123, 153, 89, 107, 98, 23]

# 新建一个Scatter实例,命名为chart
chart = Scatter()
chart.add_xaxis(x_data)
chart.add_yaxis('', y_data)
chart.render_notebook()
** 直角坐标系的专用方法
对于直角坐标系图表,都是继承自RectChart,都拥有以下方法。
*1 添加坐标轴
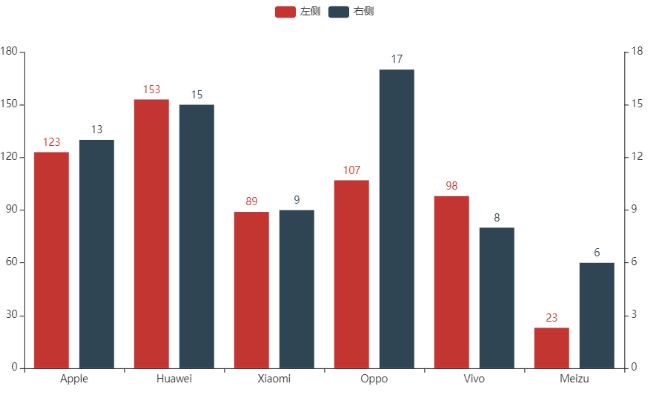
两个y轴
# 虚假数据
x_data = ['Apple', 'Huawei', 'Xiaomi', 'Oppo', 'Vivo', 'Meizu']
# 左边坐标轴的数据
y_data_1 = [123, 153, 89, 107, 98, 23]
# 右边坐标轴的数据
y_data_2 = [13, 15, 9, 17, 8, 6]

chart = Bar()
chart.add_xaxis(x_data)
# 添加应用于左边坐标轴的数据
chart.add_yaxis(
    '左侧',
    y_data_1,
    # 指定坐标轴,默认0,可省略
    yaxis_index=0
    )

# 添加应用于右侧坐标轴的数据
chart.add_yaxis(
    '右侧',
    y_data_2,
    # 指定坐标轴,默认0
    yaxis_index=1
    )

# 添加坐标轴
chart.extend_axis(yaxis=opts.AxisOpts())
chart.render_notebook()
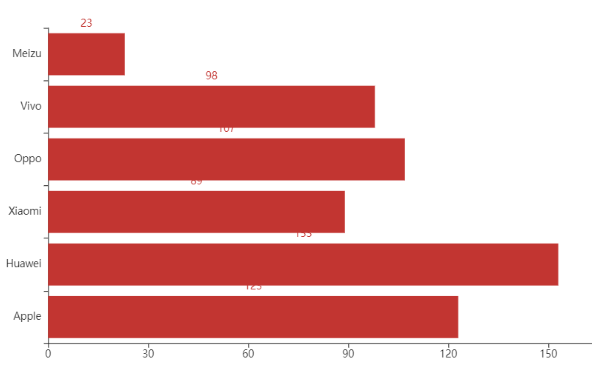
*2. xy轴翻转
# 虚假数据
x_data = ['Apple', 'Huawei', 'Xiaomi', 'Oppo', 'Vivo', 'Meizu']
y_data = [123, 153, 89, 107, 98, 23]

chart = Bar()
chart.add_xaxis(x_data)
chart.add_yaxis('', y_data)

# xy轴翻转
chart.reversal_axis()
chart.render_notebook()
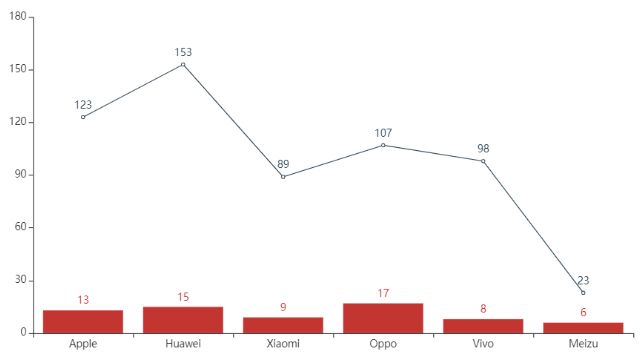
*3. 层叠多图overlap
将多个直角坐标系的图表层叠到一个坐标轴中进行展示
# 虚假数据
x_data = ['Apple', 'Huawei', 'Xiaomi', 'Oppo', 'Vivo', 'Meizu']
y_data_1 = [123, 153, 89, 107, 98, 23]
y_data_2 = [13, 15, 9, 17, 8, 6]

chart_1 = Bar()
chart_1.add_xaxis(x_data)
chart_1.add_yaxis('', y_data_2)

chart_2 = Line()
chart_2.add_xaxis(x_data)
chart_2.add_yaxis('', y_data_1)

# overlap层叠
chart_1.overlap(chart_2)
chart_1.render_notebook()
2. 地理坐标系
地理系的图表与直角坐标系也有类似之处,x轴之于经度,y轴之于经度;
在地理系图表中,常见的地理位置数据都以事先定义好了,比如北京的经度,纬度都是已知的,所以不需要你再传入经纬度数据,需要的是你提供北京对应的数值是多少;
数据格式也都是data=[(“北京”, 23), (“上海”, 33)]等形式;
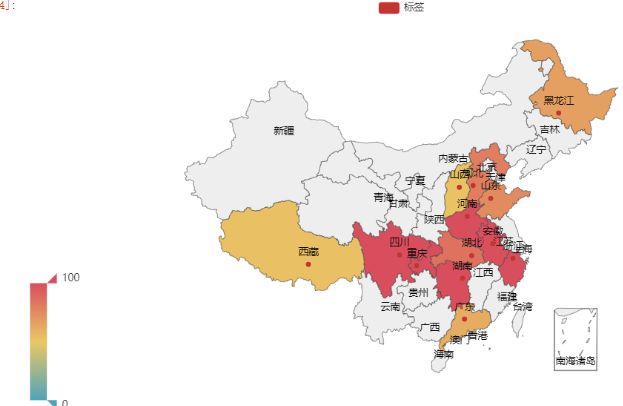
2.1 区域地图(Map)
# 虚假示例数据
data = [('广东', 61), ('湖北', 85), ('湖南', 115), ('四川', 137), ('重庆', 119), ('黑龙江', 66), ('浙江', 117),
        ('山西', 52), ('河北', 80), ('安徽', 99), ('河南', 101), ('山东', 75), ('西藏', 53)]

chart = Map()
chart.add("标签", data,
    # 必须的参数,指定地图类型
    maptype='china')

chart.render_notebook()

一般使用Map是希望能够通过地图上的区域来反映数值
需要配合视觉组件将数值直接通过颜色反映在地图之上;
# chart.add("", data,
#     # 必须的参数,指定地图类型
#     maptype='china',
#     # 不显示红点
#     is_map_symbol_show=False,
#     )
# 全局配置项
chart.set_global_opts(
    # 视觉组件是必须的,需要通过视觉组件的颜色来展示数据大小
    visualmap_opts=opts.VisualMapOpts(max_=100),
)
chart.render_notebook()
2.2 点地图(GEO)
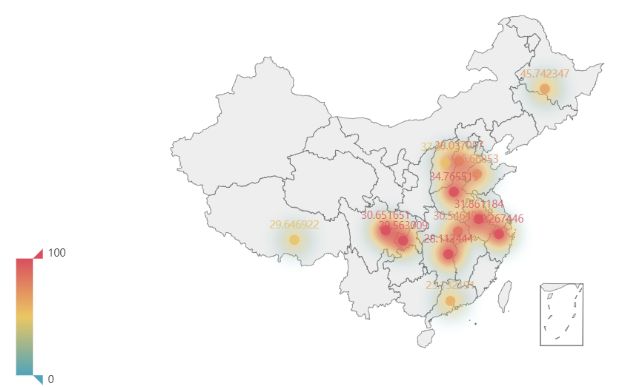
GEO支持如下Scatter(散点),effectScatter(带涟漪效果的散点),Line(流向图),HeatMap(热力图)四种展现形式;
# 虚假示例数据
data = [('广东', 61), ('湖北', 85), ('湖南', 115), ('四川', 137), ('重庆', 119), ('黑龙江', 66), ('浙江', 117),
        ('山西', 52), ('河北', 80), ('安徽', 99), ('河南', 101), ('山东', 75), ('西藏', 53)]

chart = Geo()
chart.add_schema(
    maptype='china'
)
chart.add("", data)
# 使用GEO点地图时,鼠标移动到区域上不会显示数据
chart.render_notebook()

# heatmap展示
chart.add("", data,type_='heatmap')
# 全局配置项, HeatMap需要配合视觉组件
chart.set_global_opts(
    visualmap_opts=opts.VisualMapOpts(
        type_='color'
    ),
)
chart.render_notebook()
# lines展现点地图
chart = Geo()
chart.add_schema(maptype="china")
chart.add(
    "广州出发",
    # 数据格式(from, to)
    data_pair=[("广州", "上海"), ("广州", "北京"), ("广州", "西宁"), ("广州", "重庆")],
    type_='lines'
    )

chart.render_notebook()

3. 其他图表
比如饼图,漏斗图等等;
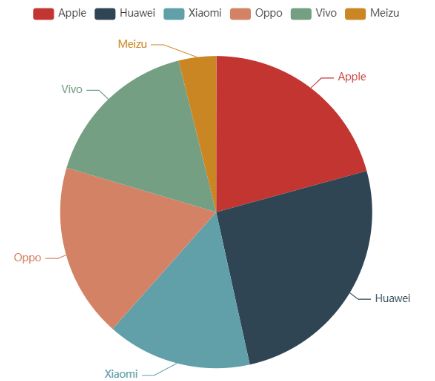
3.1 饼图
# 虚假数据
data_pair = [['Apple', 123], ['Huawei', 153], ['Xiaomi', 89], ['Oppo', 107], ['Vivo', 98], ['Meizu', 23]]
# 创建饼图对象
chart = Pie()
chart.add('', data_pair)
chart.render_notebook()
3.2 玫瑰图
 #虚假数据
data_pair = [['Apple', 123], ['Huawei', 153], ['Xiaomi', 89], ['Oppo', 107], ['Vivo', 98], ['Meizu', 23]]

chart = Pie()
chart.add('', data_pair,rosetype='radius')

chart.render_notebook()

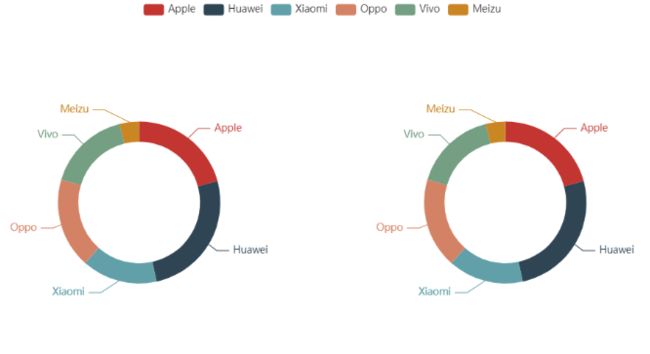
3.3 多饼图
在同一个图表中加入多个饼图,需要两个参数配合起来使用:
- radius:饼图的半径大小,一张画布里面要展示多个图,自然半径需要缩小一些;
- center:定位饼图的位置
# 虚假数据
data_pair = [['Apple', 123], ['Huawei', 153], ['Xiaomi', 89], ['Oppo', 107], ['Vivo', 98], ['Meizu', 23]]

chart = Pie()
chart.add(
       '',
       data_pair,
       # radius控制半径大小
       radius=['30%', '40%'],
       # center指定显示位置
       center=['25%', '50%']          # 放在左边
       )

chart.add(
       '',
       data_pair,
       radius=['30%', '40%'],
       center=['75%', '50%']      #放在右边的饼图
       )

chart.render_notebook()
3.4 云图
Pyecharts里面支持的词云图效果一般,更加推荐使用stylecloud的词云图。
words = [
    ("Sam S Club", 10000),
    ("Macys", 6181),
    ("Amy Schumer", 4386),
    ("Jurassic World", 4055),
    ("Charter Communications", 2467),
    ("Chick Fil A", 2244),
    ("Planet Fitness", 1868),
    ("Pitch Perfect", 1484),
    ("Express", 1112),
    ("Home", 865),
    ("Johnny Depp", 847),
    ("Lena Dunham", 582),
    ("Lewis Hamilton", 555),
    ("KXAN", 550),
    ("Mary Ellen Mark", 462),
    ("Farrah Abraham", 366),
    ("Rita Ora", 360),
    ("Serena Williams", 282),
    ("NCAA baseball tournament", 273),
    ("Point Break", 265),
]

chart = WordCloud()
chart.add("词云", words)
chart.render_notebook()

二、图表配置
- 全局配置项: 作用于整个图表(标题,视觉组件)
通过chart.set_global_opts()进行配置添加 - 系列配置项: 作用于单个系列的配置(图元,线的样式)
# 一次性导入所有图表
from pyecharts.charts import *

# 导入pyecharts的配置项
from pyecharts import options as opts
1. 全局配置
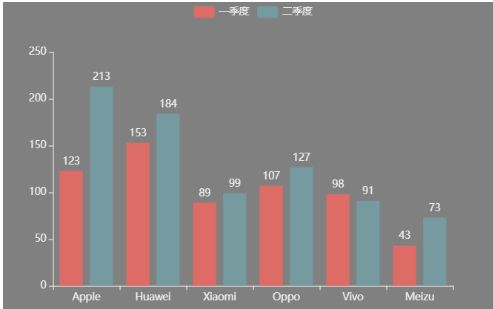
1.1 InitOpts:初始化配置项
可以初始化配置:画布大小;背景颜色,主题(内置主题)
x_data = ['Apple', 'Huawei', 'Xiaomi', 'Oppo', 'Vivo', 'Meizu']
y_data_1 = [123, 153, 89, 107, 98, 43]
y_data_2 = [213, 184, 99, 127, 91, 73]

chart = Bar(
# 初始化配置项
    init_opts=opts.InitOpts(
        width='600px',  # 画布大小
        height='400px',
        theme='dark',  # 设置主题
        bg_color='grey'  # 背景颜色
        )
    )

chart.add_xaxis(x_data)
chart.add_yaxis('一季度', y_data_1,)
chart.add_yaxis('二季度', y_data_2,)
chart.render_notebook()
1.2 TooltipOpts:提示框配置项
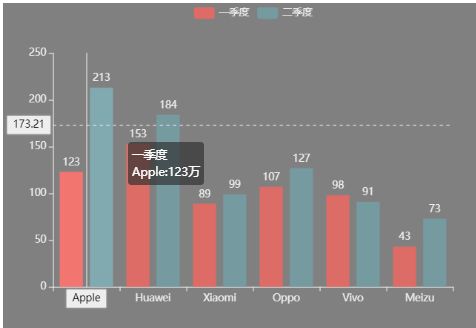
悬浮提示框,可以帮助显示更多图表的信息内容,可以配置的内容如下:
- 触发方式:鼠标点击时,鼠标平移悬浮时
- 指示器类型
- 提示框浮层样式配置
- 提示框显示内容
# 提示框配置项
chart.set_global_opts(
    tooltip_opts=opts.TooltipOpts(
        is_show=True,  # 是否使用提示框
        trigger='axis',  # 触发类型
        trigger_on='mousemove|click',  # 触发条件,点击或者悬停均可出发
        axis_pointer_type='cross',  # 指示器类型,鼠标移动到图表区可以查看效果
        formatter = '{a}
{b}:{c}万'  # 文本内容
    )
)
chart.render_notebook()
1.3 TitleOpts:标题配置项
- 主标题,副标题
- 标题添加超级链接;
- 标题位置
- 主副标题之间间距
# 创建折线图对象
chart = Line()
chart.add_xaxis(x_data)
chart.add_yaxis('',y_data_1)

chart.set_global_opts(
    # 标题配置项
    title_opts=opts.TitleOpts(
        title="我是主标题【超链接】",   # 主标题内容
        subtitle='我是副标题【也有超链接】',  # 副标题内容
        title_target='blank',  # 新建窗口打开链接
        title_link='http://www.jd.com',  # 主标题链接
        subtitle_link='http://www.taobao.com',  # 副标题链接
        subtitle_target='self',  # 当前窗口打开
        pos_left='center',  # 距离左边界距离,center表示剧中
        pos_top='5%',  # 距离上边界距离
        item_gap=20  # 主副标题之间距离
        ),
)

chart.render_notebook()

1.4 LegendOpts:图例配置项
针对图表图例的样式进行配置,可配置内容如下:
- 图例选择模式:单选 or 多选
- 图例位置
- 图例布局方式:垂直布局 or 水平布局
- 图例的icon
chart.set_global_opts(
    # 图例设置
    legend_opts=opts.LegendOpts(
        selected_mode='single',  # 设置为单选,多选=>multiple
        pos_right='10%',  # 距离右边界距离
        pos_top='2%',  # 距离上边界的距离
        orient='vertical',  # 设置诶垂直布局,默认水平布局=>horizontal
        legend_icon='circle',  # 修改图例icon

        textstyle_opts=opts.TextStyleOpts(
            color='red',  # 颜色
            font_size='12',   # 字体大小
            font_weight='bolder',   # 加粗
        )  # 文本样式配置
        )
)

chart.render_notebook()
1.5 DataZoomOpts:区域缩放配置项
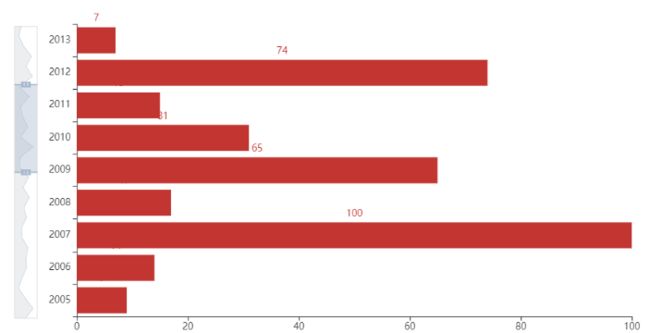
当坐标轴数据项过多时候,我们可以使用缩略轴,配置内容如下:
- 缩放类型:slider和inside两种类型
- 缩放范围:可以根据值,也可以根据百分比进行缩放;
- 是否锁点缩放区域大小:如锁定则只能进行平移,不能扩大选择范围;
- 布局方式:垂直 or 水平布局,这也决定了是对于x轴进行缩放还是y轴缩放
import random

x_data = list(range(1990,2020))
y_data = [random.randint(0, 100) for _ in x_data]

chart = Bar()
chart.add_xaxis(x_data)
chart.add_yaxis('',y_data)
# x,y轴位置互换
chart.reversal_axis()
# 全局配置
chart.set_global_opts(
    #区域缩放配置
    datazoom_opts=opts.DataZoomOpts(
        range_start=50,  # 开始范围
        range_end=80,  # 结束范围
        orient='vertical',  # 设置为垂直布局
        type_='slider',  # slider形式
        is_zoom_lock=True,  # 锁定区域大小,能看的范围被锁定
        pos_left='1%'  # 设置位置
        )
)

chart.render_notebook()
1.6 VisualMapOpts:视觉映射配置项
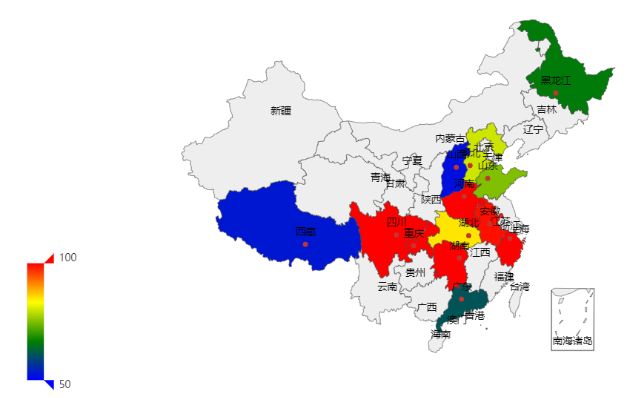
可以设置通过颜色或者图形大小来反映数据;
# 虚假示例数据-可换成人口,面积……
data = [('广东', 61), ('湖北', 85), ('湖南', 115), ('四川', 137), ('重庆', 119), ('黑龙江', 66), ('浙江', 117),
        ('山西', 52), ('河北', 80), ('安徽', 99), ('河南', 101), ('山东', 75), ('西藏', 53)]
# 创建地图对象
chart = Map()
chart.add("", data,
    # 必须的参数:指定地图类型
    maptype='china')

# 全局配置项
chart.set_global_opts(
    # 视觉组件是必须的,需要通过视觉组件的颜色来展示数据大小
    visualmap_opts=opts.VisualMapOpts(
        max_=100,  # 设置映射范围的大小
        min_=50,
        type_='color',  # 通过颜色放映数据,除此之外还有 size(图形大小),opacity(透明度)两种形式
        range_color=['blue', 'green', 'yellow', 'red']  # 映射的颜色防伪
        ),
)
chart.render_notebook()
2. 系列配置项
在Pyecharts中添加数据:chart.add(‘系列1’) ,chart.add(‘系列2’)
每次add()的就是一个系列,可以在图表上通过图例展示出来。
所以系列配置项,只会作用于在单一系列中,比如系列1中添加的配置就不会影响系列2
2.1 LabelOpts:标签配置项
标签(LabelOpts)可以配置的内容:
- 文本风格:字体大小,颜色,字体等;
- 文本显示的位置
- 显示的内容
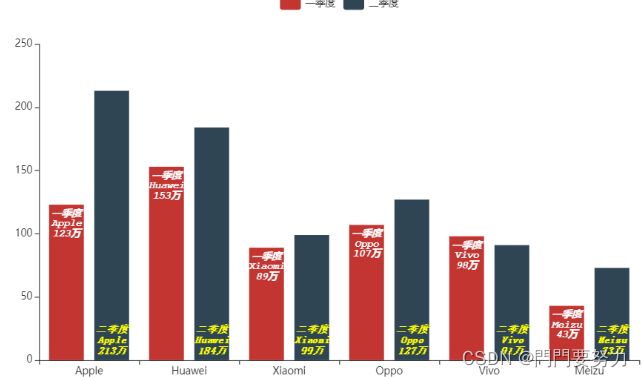
x_data = ['Apple', 'Huawei', 'Xiaomi', 'Oppo', 'Vivo', 'Meizu']
y_data_1 = [123, 153, 89, 107, 98, 43]
y_data_2 = [213, 184, 99, 127, 91, 73]

chart = Bar()
chart.add_xaxis(x_data)
chart.add_yaxis(
    '一季度',
    y_data_1,
    # 标签配置
    label_opts=opts.LabelOpts(
        font_size=12,  # 字体大小
        color='white',  # 文字颜色
        font_style='italic',  # 字体风格
        font_weight='bolder',  # 加粗
        font_family='Courier New',  # 字体
        position='insideTop',  # 显示位置
        formatter = '{a}\n{b}\n{c}万'  # 文本内容
        )
    )

chart.add_yaxis(
    '二季度',
    y_data_2,
    # 标签配置
    label_opts=opts.LabelOpts(
        font_size=12,  # 字体大小
        color='yellow',  # 文字颜色
        font_style='oblique',  # 字体风格
        font_weight='bold',  # 加粗
        font_family='monospace',  # 字体
        position='insideBottom',  # 显示位置
        formatter = '{a}\n{b}\n{c}万'  # 文本内容
        )
    )

chart.render_notebook()
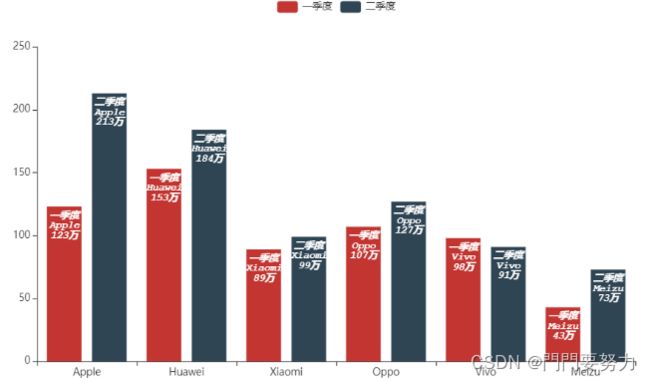
如果多个系列使用同一配置
# 虚假数据
x_data = ['Apple', 'Huawei', 'Xiaomi', 'Oppo', 'Vivo', 'Meizu']
y_data_1 = [123, 153, 89, 107, 98, 43]
y_data_2 = [213, 184, 99, 127, 91, 73]

chart = Bar()
chart.add_xaxis(x_data)

chart.add_yaxis('一季度', y_data_1,)
chart.add_yaxis('二季度', y_data_2,)

# 对图表中的全部系列生效
chart.set_series_opts(
    label_opts=opts.LabelOpts(
        font_size=12,  # 字体大小
        color='white',  # 文字颜色
        font_style='italic',  # 字体风格
        font_weight='bolder',  # 加粗
        font_family='Courier New',  # 字体
        position='insideTop',  # 显示位置
        formatter = '{a}\n{b}\n{c}万'  # 文本内容
        )
)

chart.render_notebook()
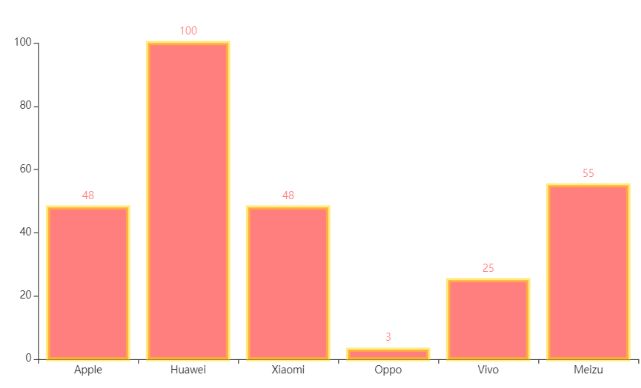
2.2 ItemStyleOpts:图元样式配置项
针对图表中的图元进行样式配置,可配置:
- 图形的颜色,透明度;
- 图形边框的颜色,线宽;
chart = Bar()
chart.add_xaxis(x_data)
chart.add_yaxis(
    '',
    y_data,
    # 图元样式配置
    itemstyle_opts=opts.ItemStyleOpts(
        color='red',  # 颜色
        opacity=.5,  # 透明度
        border_width=5,  # 边框宽度
        border_color='gold'  # 边框颜色
    )
)
chart.render_notebook()
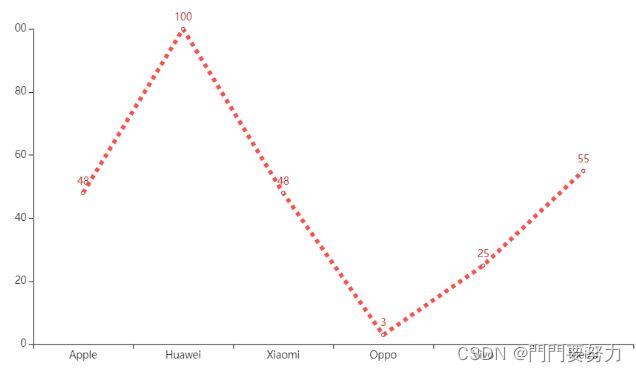
2.3 LineStyleOpts:线样式配置项
针对图表中的线样式进行配置,可配置:
- 线宽,颜色,透明度
- 弯曲程度
- 线的类型:虚线,实线等
chart = Line()
chart.add_xaxis(x_data)
chart.add_yaxis(
    '',
    y_data,
    # 连线样式配置
    linestyle_opts=opts.LineStyleOpts(
        color='red',  # 颜色
        opacity=.7,  # 透明度
        curve=0,  # 弯曲程度,0表示完全不弯曲,折线图中没用
        width=5,  # 线宽
        type_='dotted'  # 连线的类型
    )
)
chart.render_notebook()
2.4 AreaStyleOpts:区域填充样式配置项
区域填充样式配置项,可配置内容只有:1)颜色;2)透明度
chart = Line()
chart.add_xaxis(x_data)
chart.add_yaxis(
    '',
    y_data,
    # 连线样式配置
    areastyle_opts=opts.AreaStyleOpts(
        color='red',  # 颜色
        opacity=.3,  # 透明度
    )
)
chart.render_notebook()
2.5 TextStyleOpts:文字样式配置项
除了标签中的文本样式外,其他的文本内容样式都通过TextStyleOpts进行配置:
- 文字风格:字体,大小,加粗,颜色等等
- 文字块配置:背景颜色,高宽,边框
- 文字阴影
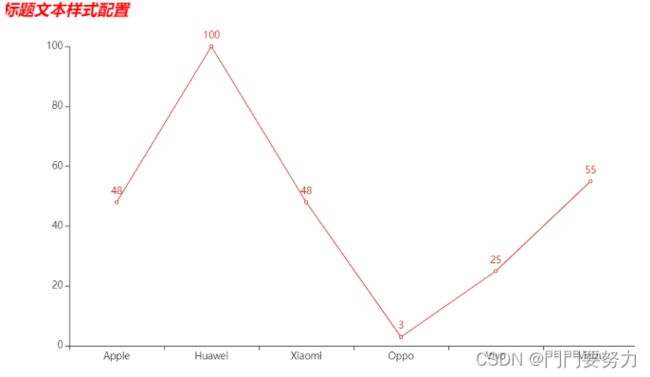
chart = Line()
chart.add_xaxis(x_data)
chart.add_yaxis('',y_data)
# 例如配置标题(TitleOpts)的文本样式
chart.set_global_opts(
    title_opts=opts.TitleOpts(
        title="标题文本样式配置",
        title_textstyle_opts=opts.TextStyleOpts(
            color='red',  # 颜色
            font_style='oblique',  # 文字风格
            font_size='20',   # 字体大小
            font_weight='bolder',   # 加粗
            align='center',  # 水平对齐
            vertical_align='center'  # 垂直对齐方式
        )
        ),
)
chart.render_notebook()
pyecharts进阶使用
学会选择合适的图表与美化方法
双Y轴(折线图+柱状图)
将不同量级的多个系列数据放到同一个图中:
比如我们在成本核算的时候需要展示当天的成本是多少,收入是多少,然后对应当天的ROI是多少,成本和收入通常都是比较大的数值,而ROI通常是约等于1的比率,这时最好的办法便是成本和收入通过直方图展示,ROI通过折线图来展示,折线图和直方图分别对应不同的Y轴。
from pyecharts.charts import *
from pyecharts import options as opts
import random

x_data = ['香蕉', '梨子', '水蜜桃', '核桃', '西瓜', '苹果']
y_data_1 = [random.randint(10, 50) for _ in range(len(x_data))]
y_data_2 = [random.randint(100, 500) for _ in range(len(x_data))]

# 新建一个直方图Bar
bar = Bar()
bar.add_xaxis(x_data)
# 添加一个Y轴
bar.extend_axis(yaxis=opts.AxisOpts())
# 通过yaxis_index指定Y轴
bar.add_yaxis(
    '左边Y轴',   # 系列名称
    y_data_1,   # 添加数据
    yaxis_index=0,   # 指定y轴,等于0时可以省略
    color='rgba(255, 0, 0, .5)'  # 未避免柱状图遮挡住折线,我们可以调整透明度
)

# 新建一个折线图Line
line = Line()

line.add_xaxis(x_data)
# 将line数据通过yaxis_index指向后添加的Y轴
line.add_yaxis(
    '右边Y轴',   # 系列名称
    y_data_2,   # 添加折线图的数据
    yaxis_index=1  # 指定使用的Y轴
)

# overlap 将两个(Bar和Line层叠在一起)
bar.overlap(line)
# 渲染图表
bar.render_notebook()
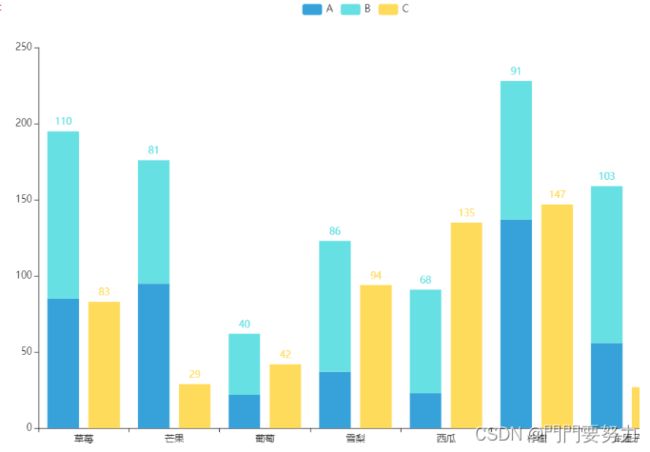
堆叠效果
以柱状图为例,对于直角坐标系图表,使用方法都是一致的;
在add_yaxis()中有个参数stack,控制不同系列数据之间是否堆叠
- 所有系列的
stack=None,则都不堆叠,stack不为空,则stack值相同的系列数据将会堆叠在一起;
from pyecharts.charts import *
from pyecharts import options as opts
from pyecharts.faker import Faker
#Pyechart中提供的示例数据的class,根据图表类型随机生成一些样例数据

bar = Bar(
    init_opts=opts.InitOpts(
        theme='light',
        width='1000px',
        height='600px')
        )

# 添加分类(x轴)的数据
bar.add_xaxis(Faker.choose())

# stack值一样的系列会堆叠在一起
bar.add_yaxis('A', Faker.values(), stack='stack1')  # A系列和B系列都是stack1,会产生堆叠
bar.add_yaxis('B', Faker.values(), stack='stack1')
bar.add_yaxis('C', Faker.values(), stack='stack2') # C系列为stack2 不与AB堆叠

bar.render_notebook()
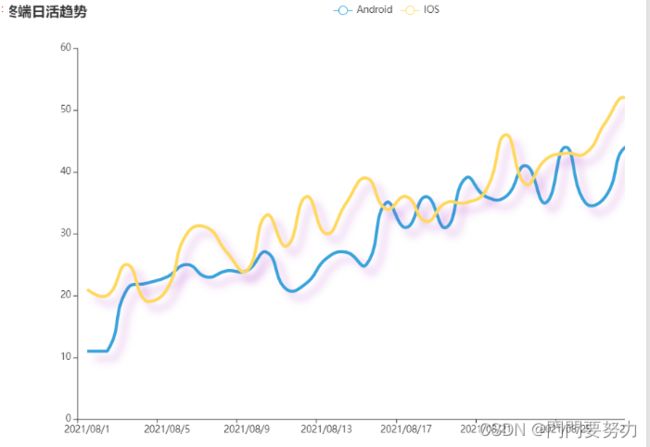
阴影效果
给元素添加阴影,让图表更加立体
# Pyecharts中封装的类支持的参数有限
# 想要实现阴影效果只能通过字典进行传参
line_style = {
    'normal': {
        'width': 4,  # 设置线宽
        'shadowColor': 'rgba(155, 18, 184, .3)',  # 阴影颜色
        'shadowBlur': 10,  # 光影大小
        'shadowOffsetY': 10,  # Y轴方向阴影偏移
        'shadowOffsetX': 10,  # x轴方向阴影偏移
        'curve': 0.5  # 线弯曲程度,1表示不弯曲
    }
}


x_data = ["2021/08/{}".format(i + 1) for i in range(31)]
# 随机生成点数据
y_data_1 = [i + random.randint(10, 20) for i in range(len(x_data))]
y_data_2 = [i + random.randint(15, 25) for i in range(len(x_data))]

line = Line(init_opts=opts.InitOpts(theme='light',
                                    width='1000px',
                                    height='600px'))
line.add_xaxis(x_data)
line.add_yaxis("Android",
               y_data_1,
               is_symbol_show=False,
               is_smooth=True,
               # 传入线风格参数
               linestyle_opts=line_style)
line.add_yaxis("IOS",
               y_data_2,
               is_symbol_show=False,
               is_smooth=True,
               # 传入线风格参数
               linestyle_opts=line_style)

# 添加标题
line.set_global_opts(title_opts=opts.TitleOpts(title="终端日活趋势"))
line.render_notebook()
阴影+径向渐变
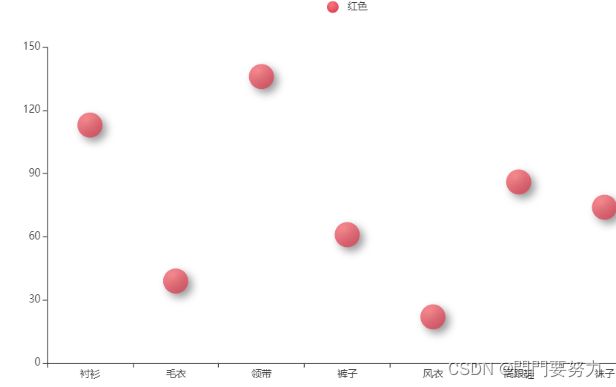
在使用散点图/气泡图的时候,添加阴影和渐变效果能起到产生非常好的视觉效果;
from pyecharts.charts import *
from pyecharts import options as opts
from pyecharts.commons.utils import JsCode
from pyecharts.faker import Faker

# 通过js代码实现渐变配色。根据自己需求修改color中的值
color_js = """new echarts.graphic.RadialGradient(0.4, 0.3, 1, [{
                offset: 0,
                color: 'rgb(251, 118, 123)'
            }, {
                offset: 1,
                color: 'rgb(204, 46, 72)'
            }])"""

scatter = Scatter()
scatter.add_xaxis(Faker.choose())

scatter.add_yaxis("红色",Faker.values(),
    symbol_size='30',
    # 渐变配色
    itemstyle_opts={
        'shadowBlur': 10,   # 光晕
        'shadowColor': 'rgba(0, 0, 0, 0.5)',  # 阴影颜色
        'shadowOffsetY': 5,  # 阴影偏移量——Y方向
        'shadowOffsetX': 5,  # 阴影偏移量——X方向
        'color': JsCode(color_js)  # 使用JsCode进行JS代码封装
    },
    label_opts=opts.LabelOpts(is_show=False),       #是否显示散点的数据值
)

scatter.render_notebook()
线性渐变
比较适合在柱形图中使用;
from pyecharts.charts import *
from pyecharts import options as opts
import random
from pyecharts.commons.utils import JsCode

# 径向渐变色的JS代码 。根据自己需求修改color对应的颜色值
color_js = """
            new echarts.graphic.LinearGradient(
                                0,
                                1,
                                0,
                                0,
                                [{offset: 0, color: '#00008B'},
                                 {offset: 1, color: '#DA70D6'}],
                                false)
           """
x_data = ["2020/7/{}".format(i + 1) for i in range(7)]

# 随机生成点数据
y_data = [random.randint(10, 20) for i in range(len(x_data))]


bar = Bar(
    init_opts=opts.InitOpts(
        theme='light',
        width='1000px',
        height='600px')
)
bar.add_xaxis(x_data)
bar.add_yaxis('',y_data,
    itemstyle_opts={
        'shadowBlur': 10,   # 光晕
        'shadowColor': 'rgba(0, 0, 0, 0.5)',  # 阴影颜色
        'shadowOffsetY': 5,  # 阴影偏移量——Y方向
        'shadowOffsetX': 5,  # 阴影偏移量——X方向
        'color': JsCode(color_js)  # 通过JsCode封装JS代码
    },
)


bar.render_notebook()

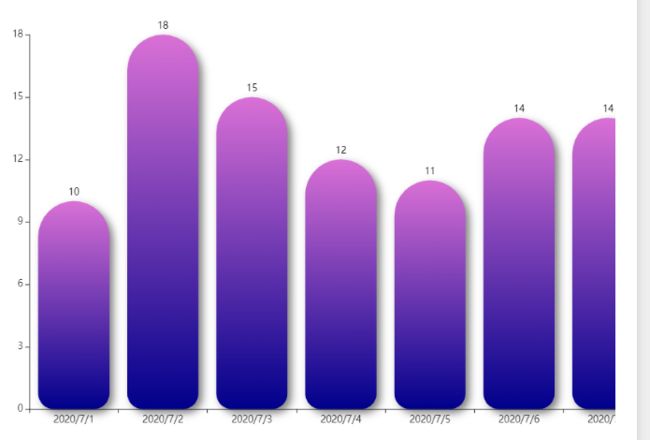
直方图设置圆角
让直方图变得更加圆润一些~
from pyecharts.charts import *
from pyecharts import options as opts
import random
from pyecharts.commons.utils import JsCode

color_js = """
            new echarts.graphic.LinearGradient(
                                0,
                                1,
                                0,
                                0,
                                [{offset: 0, color: '#00008B'},
                                 {offset: 1, color: '#DA70D6'}],
                                false)
           """
x_data = ["2020/7/{}".format(i + 1) for i in range(7)]

# 随机生成点数据
y_data = [random.randint(10, 20) for i in range(len(x_data))]


bar = Bar(
    init_opts=opts.InitOpts(
        theme='light',
        width='1000px',
        height='600px')
)
bar.add_xaxis(x_data)
bar.add_yaxis('',y_data,
    itemstyle_opts={
        'shadowBlur': 10,   # 光晕
        'shadowColor': 'rgba(0, 0, 0, 0.5)',  # 阴影颜色
        'shadowOffsetY': 5,  # 阴影偏移量——Y方向
        'shadowOffsetX': 5,  # 阴影偏移量——X方向
        'barBorderRadius':[60, 60, 20, 20],  # 圆角效果 矩形的四个角对应的半径
        'color': JsCode(color_js)
    },
)


bar.render_notebook()
关闭坐标轴显示
当我们图表中已经有标签去标注数据的时候,关闭不必要的坐标轴
from pyecharts.charts import *
from pyecharts import options as opts
import random
from pyecharts.commons.utils import JsCode

color_js = """
            new echarts.graphic.LinearGradient(
                                0,
                                1,
                                0,
                                0,
                                [{offset: 0, color: '#00008B'},
                                 {offset: 1, color: '#DA70D6'}],
                                false)
           """
x_data = ["2020/7/{}".format(i + 1) for i in range(7)]

# 随机生成点数据
y_data = [random.randint(10, 20) for i in range(len(x_data))]


bar = Bar(
    init_opts=opts.InitOpts(
        theme='light',
        width='1000px',
        height='600px')
)
bar.add_xaxis(x_data)
bar.add_yaxis('',y_data,
    itemstyle_opts={
        'shadowBlur': 10,   # 光晕
        'shadowColor': 'rgba(0, 0, 0, 0.5)',  # 阴影颜色
        'shadowOffsetY': 5,  # 阴影偏移量——Y方向
        'shadowOffsetX': 5,  # 阴影偏移量——X方向
        'barBorderRadius':[60, 60, 20, 20],
        'color': JsCode(color_js)
    },
)

bar.set_global_opts(yaxis_opts=opts.AxisOpts(is_show=False))
bar.render_notebook()

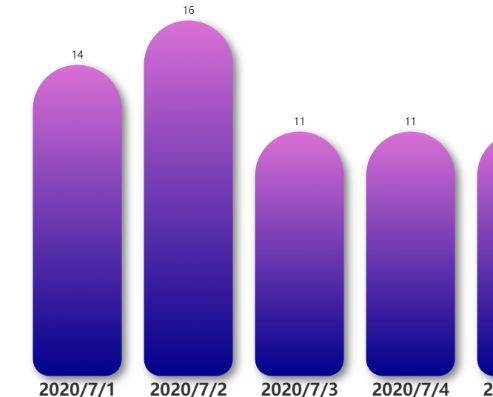
坐标轴配置
其实除了单纯的关闭/开启显示,对于坐标轴能配置的东西是非常多的;
包括坐标轴线,刻度线,坐标轴标签,分割线等都可以进行样式配置;
下面以x轴为例,关闭坐标轴线,刻度线和分割线,并对坐标轴标签样式进行修改;
from pyecharts.charts import *
from pyecharts import options as opts
import random
from pyecharts.commons.utils import JsCode

color_js = """
            new echarts.graphic.LinearGradient(
                                0,
                                1,
                                0,
                                0,
                                [{offset: 0, color: '#00008B'},
                                 {offset: 1, color: '#DA70D6'}],
                                false)
           """
x_data = ["2020/7/{}".format(i + 1) for i in range(7)]

# 随机生成点数据
y_data = [random.randint(10, 20) for i in range(len(x_data))]

bar = Bar(
    init_opts=opts.InitOpts(
        theme='light',
        width='1000px',
        height='600px')
)
bar.add_xaxis(x_data)

bar.add_yaxis(
    '',
    y_data,
    itemstyle_opts={
        'shadowBlur': 10,   # 光晕
        'shadowColor': 'rgba(0, 0, 0, 0.5)',  # 阴影颜色
        'shadowOffsetY': 5,  # 阴影偏移量——Y方向
        'shadowOffsetX': 5,  # 阴影偏移量——X方向
        'barBorderRadius':[60, 60, 20, 20],
        'color': JsCode(color_js)
    },
)

bar.set_global_opts(
    yaxis_opts=opts.AxisOpts(is_show=False),   # 关闭Y轴显示
    xaxis_opts=opts.AxisOpts(
        boundary_gap=False,  # 两边不显示间隔
        axistick_opts=opts.AxisTickOpts(is_show=False),  # 刻度不显示
        splitline_opts=opts.SplitLineOpts(is_show=False),  # 分割线不显示
        axisline_opts=opts.AxisLineOpts(is_show=False),  # 轴线不显示
        axislabel_opts=opts.LabelOpts(  # 坐标轴标签配置
            font_size=20,  # 字体大小
            font_weight='bold'  # 加重
            )
    )
    )

bar.render_notebook()
标签样式配置
标签即图形上显示的问题部分,我们可以选择关闭其显示,也可以设置其文本风格,显示位置等等;
from pyecharts.charts import *
from pyecharts import options as opts
import random

color_js = """
            new echarts.graphic.LinearGradient(
                                0,
                                1,
                                0,
                                0,
                                [{offset: 0, color: '#00008B'},
                                 {offset: 1, color: '#DA70D6'}],
                                false)
           """
x_data = ["2020/7/{}".format(i + 1) for i in range(7)]

# 随机生成点数据
y_data = [random.randint(10, 20) for i in range(len(x_data))]

bar = Bar(
    init_opts=opts.InitOpts(
        theme='light',
        width='1000px',
        height='600px')
)
bar.add_xaxis(x_data)

bar.add_yaxis(
    '',
    y_data,
    itemstyle_opts={
        'shadowBlur': 10,   # 光晕
        'shadowColor': 'rgba(0, 0, 0, 0.5)',  # 阴影颜色
        'shadowOffsetY': 5,  # 阴影偏移量——Y方向
        'shadowOffsetX': 5,  # 阴影偏移量——X方向
        'barBorderRadius':[60, 60, 20, 20],
        'color': JsCode(color_js)
    },
    label_opts=opts.LabelOpts(  # 标签设置
        font_size=25,   # 字体大小
        font_weight='bold',  # 加粗
        position='insideTop'  # 标签位置
        ),
)

bar.set_global_opts(
    yaxis_opts=opts.AxisOpts(is_show=False),   # 关闭Y轴显示
    xaxis_opts=opts.AxisOpts(
        boundary_gap=False,  # 两边不显示间隔
        axistick_opts=opts.AxisTickOpts(is_show=False),  # 刻度不显示
        splitline_opts=opts.SplitLineOpts(is_show=False),  # 分割线不显示
        axisline_opts=opts.AxisLineOpts(is_show=False),  # 轴线不显示
        axislabel_opts=opts.LabelOpts(  # 坐标轴标签配置
            font_size=20,  # 字体大小
            font_weight='bold'  # 加重
            )
    )
    )

bar.render_notebook()

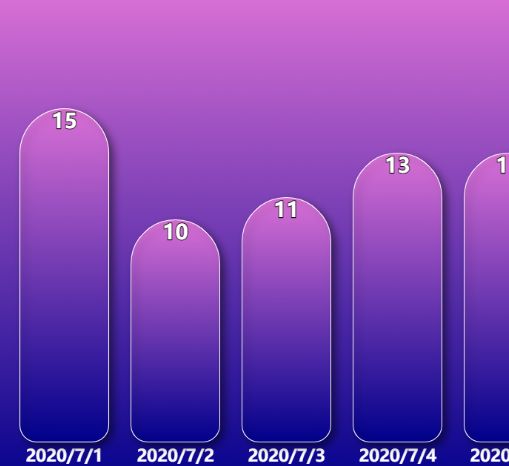
背景颜色
和图形颜色配置一致,背景颜色同样可以支持配置渐变色;
这一步为了美观,还改可以坐标轴标签的颜色+白色边框;
from pyecharts.charts import *
from pyecharts import options as opts
import random

color_js = """
            new echarts.graphic.LinearGradient(
                                0,
                                1,
                                0,
                                0,
                                [{offset: 0, color: '#00008B'},
                                 {offset: 1, color: '#DA70D6'}],
                                false)
           """
x_data = ["2020/7/{}".format(i + 1) for i in range(7)]

# 随机生成点数据
y_data = [random.randint(10, 20) for i in range(len(x_data))]

bar = Bar(
    init_opts=opts.InitOpts(
        bg_color= JsCode(color_js),
        width='1000px',
        height='600px')
)
bar.add_xaxis(x_data)

bar.add_yaxis(
    '',
    y_data,
    itemstyle_opts={
        'shadowBlur': 10,   # 光晕
        'shadowColor': 'rgba(0, 0, 0, 0.5)',  # 阴影颜色
        'shadowOffsetY': 5,  # 阴影偏移量——Y方向
        'shadowOffsetX': 5,  # 阴影偏移量——X方向
        'barBorderRadius':[60, 60, 20, 20],
        'borderColor': 'white',  # 边框颜色
        'borderWidth': 1,
        'color': JsCode(color_js)
    },
    label_opts=opts.LabelOpts(  # 标签设置
        font_size=25,   # 字体大小
        font_weight='bold',  # 加粗
        position='insideTop'  # 标签位置
        ),
)

# 全局配置坐标轴
bar.set_global_opts(
    yaxis_opts=opts.AxisOpts(is_show=False),   # 关闭Y轴显示
    xaxis_opts=opts.AxisOpts(
        boundary_gap=False,  # 两边不显示间隔
        axistick_opts=opts.AxisTickOpts(is_show=False),  # 刻度不显示
        splitline_opts=opts.SplitLineOpts(is_show=False),  # 分割线不显示
        axisline_opts=opts.AxisLineOpts(is_show=False),  # 轴线不显示
        axislabel_opts=opts.LabelOpts(  # 坐标轴标签配置
            font_size=20,  # 字体大小
            font_weight='bold',  # 加重
            color='white'  # 字体颜色
            )
    )
    )

bar.render_notebook()
添加文本框
在图表上添加一个文本框:对图表添加文字说明等
from pyecharts.charts import *
from pyecharts import options as opts
import random

color_js = """
            new echarts.graphic.LinearGradient(
                                0,
                                1,
                                0,
                                0,
                                [{offset: 0, color: '#00008B'},
                                 {offset: 1, color: '#DA70D6'}],
                                false)
           """
x_data = ["2020/7/{}".format(i + 1) for i in range(7)]

# 随机生成点数据
y_data = [random.randint(10, 20) for i in range(len(x_data))]

bar = Bar(
    init_opts=opts.InitOpts(
        bg_color=JsCode(color_js),
        width='1000px',
        height='600px')
)
bar.add_xaxis(x_data)

bar.add_yaxis(
    '',
    y_data,
    itemstyle_opts={
        'shadowBlur': 10,   # 光晕
        'shadowColor': 'rgba(0, 0, 0, 0.5)',  # 阴影颜色
        'shadowOffsetY': 5,  # 阴影偏移量——Y方向
        'shadowOffsetX': 5,  # 阴影偏移量——X方向
        'barBorderRadius':[60, 60, 20, 20],
        'borderColor': 'white',  # 边框颜色
        'borderWidth': 1,
        'color': JsCode(color_js)
    },
    label_opts=opts.LabelOpts(  # 标签设置
        font_size=25,   # 字体大小
        font_weight='bold',  # 加粗
        position='insideTop'  # 标签位置
        ),
)

bar.set_global_opts(
    yaxis_opts=opts.AxisOpts(is_show=False),   # 关闭Y轴显示
    xaxis_opts=opts.AxisOpts(
        boundary_gap=False,  # 两边不显示间隔
        axistick_opts=opts.AxisTickOpts(is_show=False),  # 刻度不显示
        splitline_opts=opts.SplitLineOpts(is_show=False),  # 分割线不显示
        axisline_opts=opts.AxisLineOpts(is_show=False),  # 轴线不显示
        axislabel_opts=opts.LabelOpts(  # 坐标轴标签配置
            font_size=20,  # 字体大小
            font_weight='bold',  # 加重
            color='white'  # 字体颜色
            )
    ),
    graphic_opts=[opts.GraphicGroup(
        graphic_item=opts.GraphicItem(
            # 将组件进行旋转
            rotation=JsCode("Math.PI / 4"),
            bounding="raw",
            right=110,
            bottom=110,
            z=2),
        # 文字显示区域配置
        children=[
            # 文字框
            opts.GraphicRect(
                graphic_item=opts.GraphicItem(
                    left="center", top="center", z=100
                ),
                graphic_shape_opts=opts.GraphicShapeOpts(
                    width=400, height=50
                ),
                graphic_basicstyle_opts=opts.GraphicBasicStyleOpts(
                    # 颜色配置,这里设置为黑色,透明度为0.5
                    fill="rgba(0,0,0,0.3)"
                ),
            ),
            # 文本设置
            opts.GraphicText(
                graphic_item=opts.GraphicItem(
                    left="center", top="center", z=100
                ),
                graphic_textstyle_opts=opts.GraphicTextStyleOpts(
                    # 要显示的文本
                    text='HITSZ',
                    font="bold 26px Microsoft YaHei",
                    graphic_basicstyle_opts=opts.GraphicBasicStyleOpts(
                        fill="#fff"
                    ),
                ),
            ),
        ],
    )
    ],
)

bar.render_notebook()

视觉组件(多个指标)
通过视觉组件来反映数值大小
同时映射到多个指标,比如同时使用透明度,颜色,大小来反映数据;
from pyecharts.charts import *
from pyecharts import options as opts
import random

x_data = [random.randint(0, 100) for _ in range(30)]
# 注意ydata中包含多个维度的数据
y_data = [(random.randint(0, 100), random.randint(0, 100), random.randint(0, 100), random.randint(0, 100))
          for _ in range(30)]

# 新建散点图
scatter = Scatter(init_opts=opts.InitOpts(theme='light',
                                          width='1000px',
                                          height='600px'))
# 添加x轴数据
scatter.add_xaxis(x_data)
# 添加y轴数据
scatter.add_yaxis('', y_data)
# dimension指定数据维度
scatter.set_global_opts(visualmap_opts=[opts.VisualMapOpts(is_show=True, type_='size', dimension=2, pos_top='5%', range_text=['大小', '']),  # 通过图形大小映射
                                        opts.VisualMapOpts(is_show=True, type_='color', dimension=3, pos_top='35%', range_text=['颜色', '']),   # 通过颜色映射
                                        opts.VisualMapOpts(is_show=True, type_='opacity', dimension=4, range_opacity=[0.2, 1], pos_top='65%', range_text=['透明度', ''])  # 通过透明度映射
                                        ],
    xaxis_opts=opts.AxisOpts(type_="value"))
scatter.render_notebook()

