【JVM】 Chapter 2 - Just In Time Compilation and the Code Cache
1. The concept of “Just In Time Compilation”
像C语言这种编译出来的机器码可以直接被操作系统理解,因此运行速度很快。Java为了跨平台,引入JVM,而JVM其实和很多Interpreter一样。我们将Java Code编译成Java Byte Code,然后JVM负责解释Java Byte Code。这样解释的速度肯定没有直接执行机器码的速度快,因此JVM搞了一个JIT
1.1 Purpose
To help get around this problem of slower execution in interpreted languages than compiled languages, the Java Virtual Machine has a feature called just in time compilation (or JIT compilation for short)
1.2 How JVM works
(1) the JVM will monitor
- which branches of code are run the most often
- which methods or parts of methods specifically loops are executed the most frequently
(2) then the virtual machine can decide that a particular method is being used a lot and so code execution would be speeded up if that method was compiled to native machine code and it will then do so.
(3) So at this point, some of our application is being run in interpretive mode as byte code and some is no longer byte code but is running as compiled native machine code.
(4) The part that has been compiled to native machine code will run faster than the byte code interpreted part (Note: by native machine code we mean executable code that can be understood directly by your operating system.)
Code runs faster the longer it is left to run
That's because the virtual machine can profile your code and work out which bits of it could be optimized by compiling them to native machine code.
The virtual machine is a multi threaded application itself so the threads within the virtual machine responsible for running the code that is interpreting the byte code and executing the byte code won’t be affected by the thread doing JIT compiling.
2. Introducing First Example
2.1 Code - PrimeNumbers.java
package main;
import java.util.ArrayList;
import java.util.List;

public class  PrimeNumbers {

	private List<Integer> primes;

	private Boolean isPrime(Integer testNumber) {
		for (int i = 2; i < testNumber; i++) {
			if (testNumber % i == 0) return false;
		}
		return true;
	}

	private Integer getNextPrimeAbove(Integer previous) {
		Integer testNumber = previous + 1;
		while (!isPrime(testNumber)) {
			testNumber++;
		}
		return testNumber;
	}

	public void generateNumbers (Integer max) {
		primes = new ArrayList<Integer>();
		primes.add(2);

		Integer next = 2;
		while (primes.size() <= max) {
			next = getNextPrimeAbove(next);
			primes.add(next);
		}
		System.out.println(primes);
	}
}
2.2 Code - Main.java
package main;
import java.util.Date;

public class Main {

	public static void main(String[] args) {
		PrimeNumbers primeNumbers = new PrimeNumbers();
		Integer max = Integer.parseInt(args[0]);
		primeNumbers.generateNumbers(max);
	}

}
2.3 Output 1: java Main 10
by using command line: java Main 10

2.4 Compiling Flags
Now the way that we can find out what kind of compensation is happening when the Java Virtual Machine is running our code is by providing a flag to the Java Virtual Machine which is
-XX:+PrintCompilation
- -XX means this an advanced option, and XX must be in capitals
- a plus(+) or a minus(-) indicates if we want the option to be switched on or off
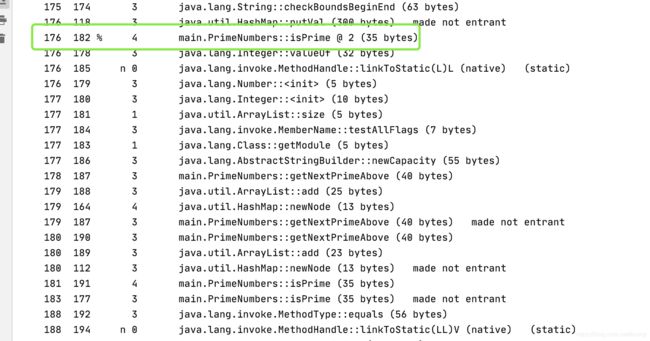
Output of Java -XX:+PrintCompilation Main 10:

- The first column here is the number of milliseconds since the virtual machine started.
- The second column is the order in which the method or code block was compiled. (Now don’t worry that these numbers don’t appear in order. It just means that some parts took longer to compile than others. This could be due to multi threading issues or the complexity or length of the code being compiled.)
- The third column that has an n in and has an s in.
- The n means native method
- The s means it’s a synchronized method.
- An Exclamation Mark ! would mean there’s some exception handling going on
- A percentage symbol % would mean that the code has been natively compiled and is now running in a special part of memory called the code cache. a percentage symbol in here means that the method is now running in the most optimal way possible.
- The fourth column has a number from 0 to 4. This tells us what kind of compiling has taken place.
- 0 would mean no compilation. i.e. The code has just been interpreted.
- 1 to 4 mean that a progressively deeper level of compilation has happened.
2.3 Output 2: java Main 5000
by using command line: java Main 5000
Output of Java -XX:+PrintCompilation Main 5000:

Now the isprime has been placed in the code cache.
So let’s talk now about this number here.
3.The C1 and C2 Compilers and logging the compilation activity
3.1 C1 and C2 Compilers
There are actually two compilers built into the Java Virtual Machine called C1 and C2.
- C1 compiler is able to do the first three levels of compilation. Each has progressively more complex than the last one
- C2 compiler can do the fourth level
The virtual machine decides which level of compilation to apply to a particular block of code based on how often it is being run and how complex or time consuming it is. This is called profiling the code.
So for any method which has a number of one to three the code has been compiled using the C1 compiler. The higher the number the more profile the code has been.
If the code has been called enough times then we reach Level 4 and the C2 compiler has been used instead. This means that our code is even more optimised than when it was compiled using the C1 compiler. Not only is the JVM going to compile it to Level 4 it is also going to put that compiled code into the code cache, the special area of memory because that will be the quickest way for it to be accessible and therefore run so the higher the level of compilation.
The virtual machine doesn’t just optimize everything to tier 4 because there is a trade-off (权衡).
3.2 Logging the compilation activity
-XX:+UnlockDiagnosticVMOptions
-XX:+LogCompilation
java -XX:+UnlockDiagnosticVMOptions -XX:+LogCompilation Main 5000:

4. Tuning the code cache size
4.1 C1 and C2 Compilers
The code cache has a limited size and if there are lots of methods that could be compiled to this level well then some will need to be removed from the code cache to make space for the next one to be inserted and the removed method could be weakened powered and be added later on.
In other words in large applications with lots of methods that could be compiled to level four over time. Some methods might be moved into the code cache then moved out then moved back again and so on.
Now when this happens the default code cache size might not be sufficient and increasing the size of the code cache can lead to an improvement in our application’s performance.
Now if that happens you might see the following warning message appear in the console of your application.

The warning messages: codecache is full. Compiler has been disabled.
This is telling us that the code would run better if another part of it could be compiled to native machine code. But there’s no room for it in the code cache. What’s more, all the code that is in the code cache is actively being used. So there’s no part of the code cache that can easily be cleaned up.
This is a warning message it doesn’t stop your application running but it does mean that it’s not running in an optimal way.
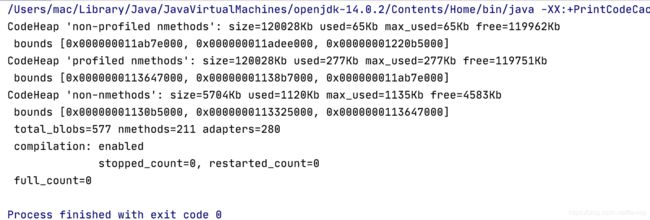
Now we can find out about the size of the code cache by using a JVM flag to print code cache, which is:
-XX:+PrintCodeCache
Output of Java -XX:+PrintCodeCache Main 5000:

The maximum size of the code cache is dependent on which version of java you are using. If you were using Java 7 or below then it was either 32 or 48 megabytes. It was 48 megabytes If you’re using the 64 bit JVM and 32 megabytes if you’re using the 32 bit JVM.
If you’re using Java 8 or above and you’re using the 64 bit JVM then the code cache can be up to two hundred and forty megabytes.
We can change the code cache size with three different flags:
-XX:InitialCodeacheSize
-XX:ReservedCodeCacheSize
-XX:CodeCacheExpansionSize
- InitialCodeacheSize is the size of the code cache when the application starts. This is normally quite small the default size varies based on your computer’s available memory but it’s often allowed about 160 kilobytes
- ReservedCodeCacheSize is the maximum size of the code cache. In other words the code cache can grow over time up to the size of the reserved cod cache
- CodeCacheExpansionSize dictates how quickly the code cache should grow as it gets full.
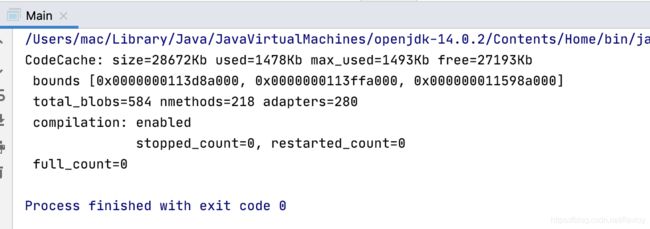
So by using the initial code cache size and the reserved code cache size, we can say how much we want it to be initially and how much it could grow up to if needed.
java -XX:ReservedCodeCacheSize=28m -XX:+PrintCodeCache Main 5000

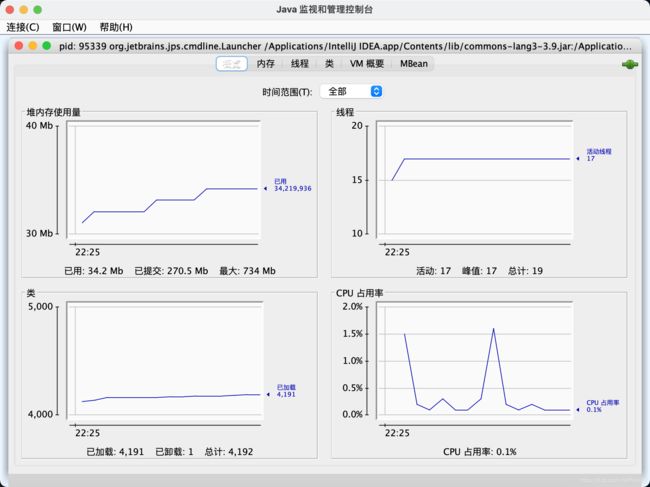
5. Remotely monitoring the code cache with JConsole
5.1 JConsole
There is an application that we can use to monitor the code cache usage over time. And this is particularly useful if your application is running on a remote server somewhere but you want to monitor it from your computer. It’s an application called JConsole.

