异常检测 | MATLAB实现基于支持向量机和孤立森林的数据异常检测(结合t-SNE降维和DBSCAN聚类)
异常检测 | MATLAB实现基于支持向量机和孤立森林的数据异常检测(结合t-SNE降维和DBSCAN聚类)
目录
-
- 异常检测 | MATLAB实现基于支持向量机和孤立森林的数据异常检测(结合t-SNE降维和DBSCAN聚类)
-
- 效果一览
- 基本介绍
- 模型准备
- 模型设计
- 参考资料
效果一览
![]()
![]()
![]()
基本介绍
提取有用的特征,机器学习通常可以在少得多的数据上为您提供与深度学习相当或更好的结果。与在少得多的数据上的深度学习相比,可以获得可比或更好的结果。然后,我们将SVM、孤立森林(R2021b 中的新功能)、稳健协方差和马氏距离、DBSCAN 聚类方法应用于异常检测:
在该数据上, SVM 的性能最好,孤立森林可以接受,而马氏距离效果不佳。
模型准备
虽然深度学习需要大数据集,但机器学习方法需要的数据要少得多。机器健康并产生“正常”数据。 通常,可以使用的“异常”数据要少得多,但大多数异常检测方法都假设:主要拥有正常数据。
load("FeatureSmall.mat");
rng;

% show distribution in this small data set
st = groupcounts(featureSmall,"label")
outlierFraction = st.Percent(1)/100;    % remember fraction of anomalies in data

% divide subset into train and (held out) test
idxSmall = cvpartition(featureSmall.label,'holdout',0.2);
featSmallTrain = featureSmall(idxSmall.training,:);
featSmallTest = featureSmall(idxSmall.test,:);
trueAnomaliesTest = featSmallTest.label;
模型设计
- 监督方法:训练分类器
原始数据集是相当平衡的,在“之后”和“之前”维护的相同顺序样本中,代表正常和异常的操作条件。 对于在这两种情况下都有大量标记数据的用例,可以简单地应用标准的监督学习并构建分类器。 下图说明了可用标记数据量与一些可能的异常检测方法之间的关系。

- 对于这个数据集,我们位于适合监督学习的右上象限。 几种机器学习算法都取得了不错的分类准确率——说明我们之前提取的特征相当不错。 下面我们展示了验证准确性,以及最佳模型的混淆矩阵,即树集成。


- 对于这个例子的其余部分,为了现实起见,我们将通过从训练集中删除“之前”数据来假装我们主要有正常数据可用。 然后我们可以演示如何应用右下象限中提到的方法:只训练正常数据,然后尝试识别异常。
- 异常检测的统计和机器学习方法,使用 SVM 检测异常
支持向量机是强大的分类器,它们的变体训练仅对“正常”数据进行建模,并且可以很好地识别异常。
% identify subset of "normal" (healthy) data in training
healthyIdx = featSmallTrain.label=="Normal";
trainHealthy = featSmallTrain(healthyIdx,2:13);   % can safely skip labels column since we only have one class
trainHealthyN = size(trainHealthy,1);

% train one-class SVM. On this data, training just on the "normal" (healthy) data works better
mdlSVM = fitcsvm(trainHealthy,ones(trainHealthyN,1),'Standardize',true,'OutlierFraction',0);

% this variant trains on all data (including anomalies), with the estimated fraction
%mdlSVM = fitcsvm(featSmallTrain(:,2:13),ones(size(featSmallTrain,1),1),'Standardize',true,'OutlierFraction',outlierFraction);

% apply to "small" test data (which has both anomalies and healthy data)
[~,scoreSVM] = predict(mdlSVM,featSmallTest(:,2:13));
isanomalySVM = scoreSVM<0;
predSVM = categorical(isanomalySVM, [1, 0], ["Anomaly", "Normal"]);

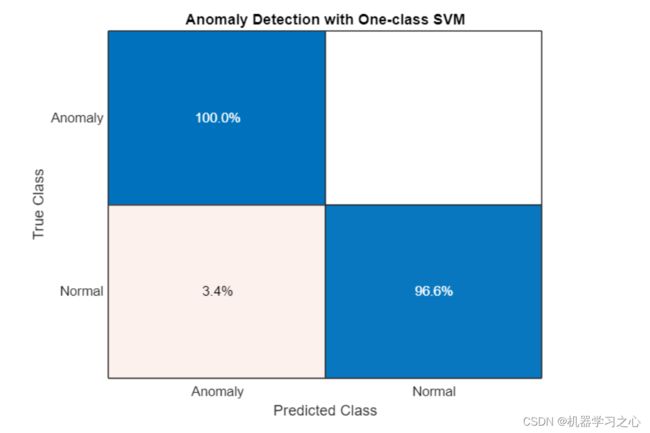
confusionchart(trueAnomaliesTest,predSVM,Title="Anomaly Detection with One-class SVM",Normalization="row-normalized");
- 我们可以看到 SVM 表现良好,所有异常样本都被识别出来,只有 4% 的“健康”样本被误判。
- 使用孤立森林森林检测异常,孤立森林森林的决策树将每个观察值隔离在一片叶子中。 一个样本经过多少次决策才能到达其叶子节点是衡量将其与其他样本隔离开来的复杂程度。 特定样本的树的平均深度用作它们的异常分数,并由 iforest 返回。
% train on normal (healthy) data only. Need to tune the ContimationFraction!
[mdlIF,~,scoreTrainIF] = iforest(trainHealthy,'ContaminationFraction',0.05);

[isanomalyIF,scoreTestIF] = isanomaly(mdlIF,featSmallTest(:,2:13));
predIF = categorical(isanomalyIF, [1, 0], ["Anomaly", "Normal"]);

confusionchart(trueAnomaliesTest,predIF,Title="Anomaly Detection with Isolation Forest",Normalization="row-normalized");
- 在这个数据上,孤立森林的表现不如SVM,但它在其他数据集上的表现优于其他方法而变得流行。
- 为了更好地了解孤立森林的工作原理,可视化其异常分数的分布可能会有所帮助。
%To better understand how the isolation forest works, it can be helpful to visualize the distribution of its anomaly scores.
% visualize the anomaly score distributions for train vs test
figure;
histogram(scoreTestIF,Normalization="probability");
hold on
histogram(scoreTrainIF,Normalization="probability");
xline(mdlIF.ScoreThreshold,"k-", join(["Threshold =" mdlIF.ScoreThreshold]))
legend("Test data","Training data",Location="southeast")
title("Histograms of Anomaly Scores for Isolation Forest")
hold off
- 训练和测试数据分布的差异在于后者包含一些“异常”数据——而训练没有,我们将阈值设置得恰到好处,以正确识别大部分异常数据。
- 使用稳健协方差检测异常,作为检测异常的统计方法,可以估计稳健的协方差(和均值),然后将异常识别为位于分布的边缘(异常值)。 稳健的估计器处理包含异常值并偏离多元正态性假设的数据。
featSmallTrainM = table2array(featSmallTrain(:,2:13));    % robustcov expects input as matrix, not table
featSmallTestM = table2array(featSmallTest(:,2:13));

% compute robust covariance on both normal and (typically only a little)
% anomalous data - which is not the case for this data!
[sigma,mu,mahalDistRobust,~] = robustcov(featSmallTrainM, OutlierFraction=outlierFraction);
sigRobustThresh = sqrt(chi2inv(1-outlierFraction,size(featSmallTrainM,2)));

% identify anomalies on new (test) data with Mahalanobis distance
scoreTestMahal = pdist2(featSmallTestM,mu,"mahalanobis",sigma);
isanomalyMahal = scoreTestMahal > sigRobustThresh;
predMahal = categorical(isanomalyMahal, [1, 0], ["Anomaly", "Normal"]);

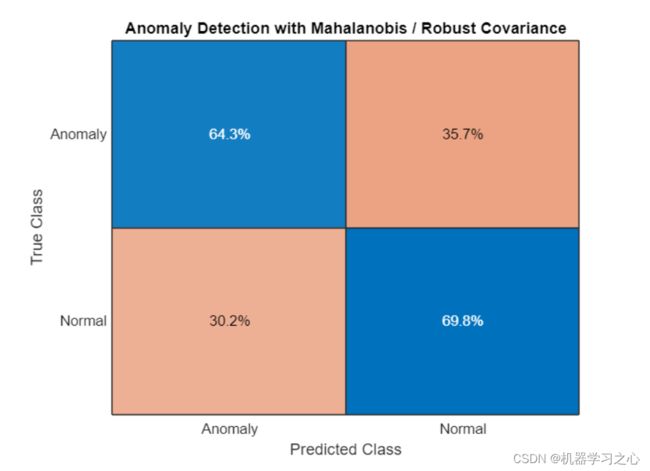
confusionchart(trueAnomaliesTest,predMahal,Title="Anomaly Detection with Mahalanobis / Robust Covariance",Normalization="row-normalized");
- 稳健协方差在该数据上效果不佳.
- 可视化各种异常检测方法,可视化可以帮助解释分类方法为何有效以及何时无效,这也适用于异常检测。 如果您正在处理多个维度,则必须在可视化之前降低维度。 压缩多个维度的一种方便方法是随机邻域嵌入 tsne。 t-SNE 倾向于将数据分组到集群中,因为它最小化了二维空间中的 Kullback-Leibler 散度,但不要过度解释它们:这些分组并不总是存在于原始高维数据中。
% use t-SNE to reduce the 12 features into a two-dimensional space
T = tsne(featSmallTestM);

% compare the various anomaly detection methods visually, starting with
% "ground truth" (labels)
figure;
tiledlayout(2,2)
nexttile
gscatter(T(:,1),T(:,2),trueAnomaliesTest,"kr",".o",[],"off");
title("Ground Truth")
legend("Normal","Anomalous");
nexttile(2)
gscatter(T(:,1),T(:,2),predIF,"kr",".o",[],"off")
title("Isolation Forest")
nexttile(3)
gscatter(T(:,1),T(:,2),predSVM,"kr",".o",[],"off")
title("One-class SVM")
nexttile(4)
gscatter(T(:,1),T(:,2),predMahal,"kr",".o",[],"off")
title("Robust Mahalanobis Distance")
- 我们可以看到,上方区域的异常数据簇和左下方的正常数据簇,大多被一类SVM和隔离森林正确识别,而没有被马氏距离分开 (至少在t-SNE转换 12 个特征的二维空间中)。
- 应用聚类检测异常,还可以应用聚类来识别数据中的组,并将这些组中的哪些组与正常样本和异常样本相关联。 这在视觉上更容易完成,所以让我们使用 t-SNE 总结原始 12 个特征的两个维度,并应用像 dbscan 这样的基于距离的聚类方法。 它需要一些实验来找到距离参数 epsilon 和最小集群大小的正确设置。
trainSmallSNE = tsne(featSmallTrainM);
mdlDB = dbscan(trainSmallSNE,5,20);
figure
gscatter(trainSmallSNE(:,1),trainSmallSNE(:,2),mdlDB);
参考资料
[1] https://blog.csdn.net/kjm13182345320/article/details/124864369
[2] https://blog.csdn.net/kjm13182345320/article/details/127896974?spm=1001.2014.3001.5502


