跟着我学Python基础篇:04.循环
往期文章
跟着我学Python基础篇:01.初见端倪
跟着我学Python基础篇:02.数字与字符串编程
跟着我学Python基础篇:03.选择结构
目录
- 往期文章
- 1. while循环
-
- 1.1 语法
- 1.2 常见的错误
- 1.3 处理警戒值
- 1.4 输入与输出重定向
- 2. for循环
-
- 2.1 语法
- 2.2 带range函数的print函数
- 3. 嵌套循环
-
- 3.1 用嵌套的循环来打印一个x的n次幂的表格:
- 3.2 用嵌套循环打印成绩分布直方图
1. while循环
1.1 语法
while condition:
    statements
只要condition一直成立,while语句中的语句就会一直执行,这个语句块叫作while语句的循环体。
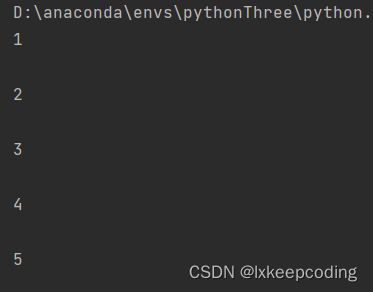
a=0

while a<5:
    a+=1
    print(a)
    print()
1.2 常见的错误
- 无限循环
忘记更新控制循环的变量
把本应减少的计数增加了 - 差一错误
要严谨地使用<,<=
1.3 处理警戒值
当我们要读取一系列的输入时,就需要有方法能够结束这个输入,用来作为结束的符号,叫作警戒值。
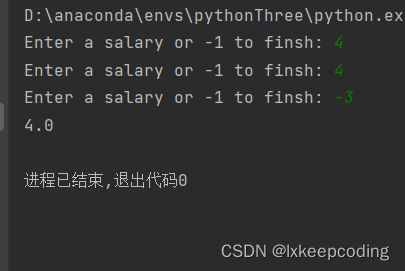
让我们在计算一组工资值的平均值的程序中使用这个技术,在循环内部,我们读取一个输入,如果输入是非负值,我们就处理它。
total=0.0
count=0
salary=0.0
while salary>=0.0:
    salary=float(input("Enter a salary or -1 to finsh: "))
    if salary>=0.0:
        total=total+salary
        count=count+1
print(total/count)
done=False
while not done:
    value=float(input("Enter a salary or -1 to finish : "))
    if value<0.0:
        done=True
    else:
        Process value
用于决定循环是否结束的真正测试在循环中间进行,而不是在顶部,这称作半路循环,因为执行到半路才能知道循环是否应该结束,作为一只替换,也可以使用break语句:
while True:
    value=float(input("Enter a salary or -1 to finish: "))
    if value<0.0:
        done=True
    else:
        break
break语句会跳出所在循环,与循环条件无关。当遇到break语句时,循环结束,继续执行接下来的语句。
在半路循环中,break是非常有用的。
1.4 输入与输出重定向
操作系统的命令行界面提供了一种方法可以把文件连接到程序的输入,就好像文件中的所有字符由用户输入一样。如果你键入:
python sentinel.py<numbers.txt
程序被执行,所有的输入命令都会从文件numbers.txt中获取他们的输入,这个叫输入的重定向。
如果你运行:
python sentinel.py<numbers.txt>output.txt
文件output.txt中包含了输入提示和最终输出。
2. for循环
2.1 语法
for variable in container:
    statements
stateName="Tom"
for letter in stateName:
    print(letter)
2.2 带range函数的print函数
range函数根据参数生成一系列值,第一个参数是序列的第一个值,小于第二个参数值的数值都会被包含在生成的序列中。
#只有一个参数,序列从0开始
for i in range(5):
    print(i,end=" ")
print()
#使用两个参数序列从第一个参数开始
for i in range(1,5):
    print(i, end=" ")
print()
#使用三个参数,第三个参数表示步长
for i in range(1,11,2):
    print(i, end=" ")
3. 嵌套循环
循环是可以嵌套的。
3.1 用嵌套的循环来打印一个x的n次幂的表格:
#
NMAX=4
XMAX=10

#
for n in range(1,NMAX+1):
    print("%10d"%n,end="")

print()

for n in range(1,NMAX+1):
    print("%10s"%"x ",end="")

print("\n","    ","-"*35)

#
for x in range(1,XMAX+1):
    for n in range(1, NMAX + 1):
        print("%10.0f" % x ** n, end="")
    print()
3.2 用嵌套循环打印成绩分布直方图
from matplotlib import pyplot
numAs=0
numBs=0
numCs=0
numDs=0
numEs=0

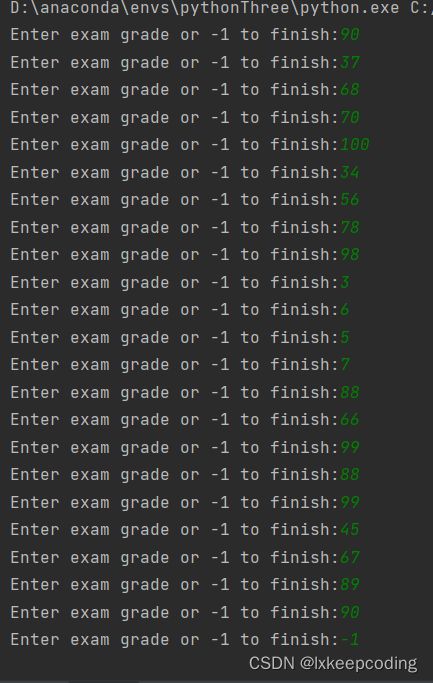
grade = int(input("Enter exam grade or -1 to finish:"))
while grade>=0:
    if grade>=90.0:
        numAs+=1
    elif grade>=80.0:
        numBs+=1
    elif grade>=70.0:
        numCs+=1
    elif grade>=60.0:
        numDs+=1
    else:
        numEs+=1
    grade = int(input("Enter exam grade or -1 to finish:"))


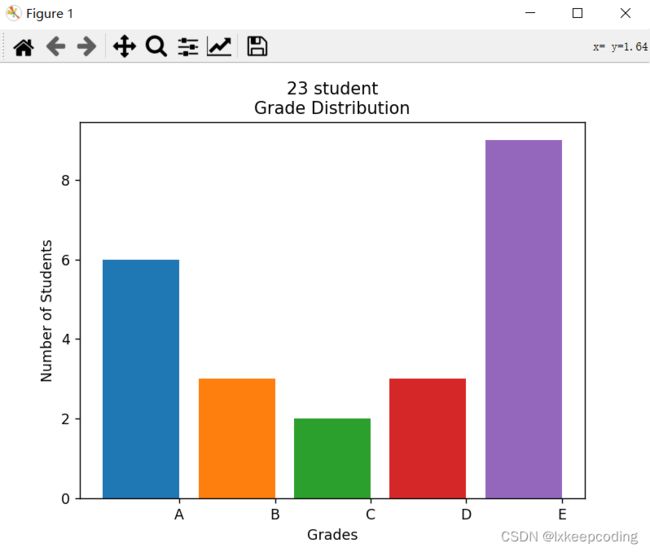
pyplot.bar(1,numAs)
pyplot.bar(2,numBs)
pyplot.bar(3,numCs)
pyplot.bar(4,numDs)
pyplot.bar(5,numEs)

pyplot.xlabel("Grades")
pyplot.ylabel("Number of Students")

numStudents=numEs+numAs+numBs+numCs+numDs
pyplot.title("%d student\nGrade Distribution"%numStudents)

pyplot.xticks([1.4 ,2.4, 3.4 ,4.4 ,5.4],["A","B","C","D","E"])

pyplot.show()


