Chapter 9 Using Log Analyzer 第九章使用日志分析器
Chapter 9 Using Log Analyzer
第九章使用日志分析器
Understanding Log Analyzer
了解日志分析器
Log Analyzer for Application Engine is an User Interface tool that helps you format the Application Engine log file to easily get log information about:
Log Analyzer for Application Engine是一个用户界面工具,可帮助您格式化应用程序引擎日志文件,以轻松获取有关以下内容的日志信息:
- Application Engine call structure
- 应用引擎调用结构··
- SQL information
- SQL信息
- PeopleCode information
- PeopleCode信息
You can launch the Log Analyzer tool by executing runTraceAnalyzer.bat file located at PS_HOME\bin \client\winx86\AELogAnalyzerTool.
您可以通过执行位于PS_HOME\bin\client\winx86\AELogAnalyzerTool的runTraceAnalyzer.bat文件来启动日志分析器工具。
Related Links
Enabling Log Analyzer for Application Engine
相关链接为应用程序引擎启用日志分析器
Application Engine Call Structure
应用程序引擎调用结构
This image illustrates the Application Engine call structure in Log Analyzer:
此图像说明了日志分析器中的应用程序引擎调用结构:
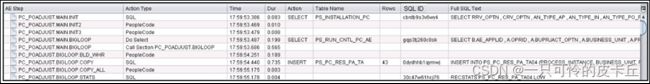
By using the Log Analyzer for Application Engine, you can display the application engine call structure as a tree structure in a table panel. The table panel displays the following log information:
通过使用Application Engine的Log Analyzer,您可以在表面板中将应用程序引擎调用结构显示为树结构。表面板显示以下日志信息:
| Term |
Definition |
| AE Step |
The Application Engine Step column displays the Application Engine steps executed in the AE process. |
| Term |
Definition |
| Action Type |
The Action Type column displays the Application Engine action type performed in the Application Engine step. Application Engine action types can be any one of the following:
|
| Time |
The Time column displays the time at which the Application Engine action was executed. |
| Duration |
Displays the duration of the action. |
| Action |
The action column displays the SQL action that was performed in the Application Engine step. SQL actions can be any one of the following:
|
| Table Name |
The Table Name column displays the name of the table in which the action was performed. |
| Rows |
The Rows column displays the number of rows that were updated by the action. |
| Term |
Definition |
| SQL ID |
The SQL ID column displays the performance details of the Application Engine step. The SQL ID column displays a unique identifier of the SQL statement when run on Oracle databases. This is useful for Application Engine SQL performance analysis. Note: SQL ID is specific to Oracle database so this column is only displayed when we are analyzing an AET file generated against an Oracle database. |
| Full SQL Text |
The Full SQL Text column displays the full SQL text that was run for the SQL action. |
SQL Information
SQL信息
By using the Log Analyzer feature, you can access the SQL information for any Application Engine step that was executed. See SQL Traces for more information.
通过使用日志分析器功能,可以访问所执行的任何应用程序引擎步骤的SQL信息。有关详细信息,请参阅SQL跟踪。
PeopleCode Information
PeopleCode信息
You can load the .TRC file of the AE program to access the corresponding PeopleCode information associated to the selected node.
您可以加载AE程序的.TRC文件以访问与所选节点相关联的相应PeopleCode信息。
Note: ‘Trace start of programs’ must be enabled to access PeopleCode Information using Log Analyzer for AE.
注意:必须启用“跟踪程序的启动”,才能使用AE的日志分析器访问PeopleCode信息。
Related Links
Understanding Trace Results Setting Options in PeopleSoft Configuration Manager (two-tier mode)
相关链接了解PeopleSoft配置管理器中的跟踪结果设置选项(两层模式)
Filter
筛选
You can use the Log Analyzer feature to access filtered information about the AE process.
您可以使用日志分析器功能访问有关AE过程的过滤信息。
This example illustrates the fields and controls on the Filter Option in Log Analyzer:
此示例说明了日志分析器中的过滤器选项上的字段和控件:

The AE process information can be filtered by:
- SQL statement action
- Text
- Duration
- Rows updated
- Temporary Table Data
| Filter by |
Action |
| SQL Statement action |
Displays filtered information about the AE process based on the following SQL statement actions:
|
| Text |
Displays filtered information about the AE process based on text. |
| Duration |
Displays filtered information about the AE process based on duration of the steps. |
| Rows updated |
Displays filtered information about the AE process based on the number of rows that were updated in the AE process. |
| Temporary table data |
Displays filtered information about the AE process with temporary table data. |
Related Links
Analyzing Application Engine Programs
相关链接分析应用引擎程序
Enabling Log Analyzer for Application Engine
为应用程序引擎启用日志分析器
By default, the Log Analyzer for application engine feature is turned off. To see logs for an application engine program, you must set trace options before you run the program.
默认情况下,应用程序引擎的日志分析器功能处于关闭状态。若要查看应用程序引擎程序的日志,必须在运行程序之前设置跟踪选项。
This section discusses how to:
本节讨论如何:
- Set options in Configuration Manager (two-tier mode)
- ·在配置管理器中设置选项(两层模式)
- Set options in domain configuration files (three-tier mode)
- 在域配置文件中设置选项(三层模式)
- Set options to trace a specific application engine program
- 设置选项以跟踪特定的应用程序引擎程序
Related Links
Understanding Log Analyzer
“Understanding PeopleSoft Configuration Manager” (System and Server Administration) Locating Trace Files
相关链接了解日志分析器"了解PeopleSoft配置管理器"(系统和服务器管理)定位跟踪文件
Setting Options in PeopleSoft Configuration Manager (two-tier mode)
在PeopleSoft配置管理器中设置选项(两层模式)
For processes running on a Microsoft Windows workstation, you can enable Log analyzer for Application Engine by setting trace options using the Trace tab in PeopleSoft Configuration Manager. This procedure is valid only if you are running Application Engine programs on a Microsoft Windows workstation in a development environment.
对于在微软Windows工作站上运行的进程,您可以通过使用PeopleSoft配置管理器中的“跟踪”选项卡设置跟踪选项来启用“应用程序引擎日志分析器”。此过程仅在自开发环境中的Microsoft Windows工作站上运行应用程序引擎程序时有效。
This example illustrates the fields and controls on the Enabling Log Analyzer for Application Engine by setting options in Configuration Manager. You can find definitions for the fields and controls later on this page.
此示例通过在配置管理器中设置选项阐释了启用应用程序引擎日志分析器上的字段和控件。您可以在本页稍后找到字段和控件的定义。
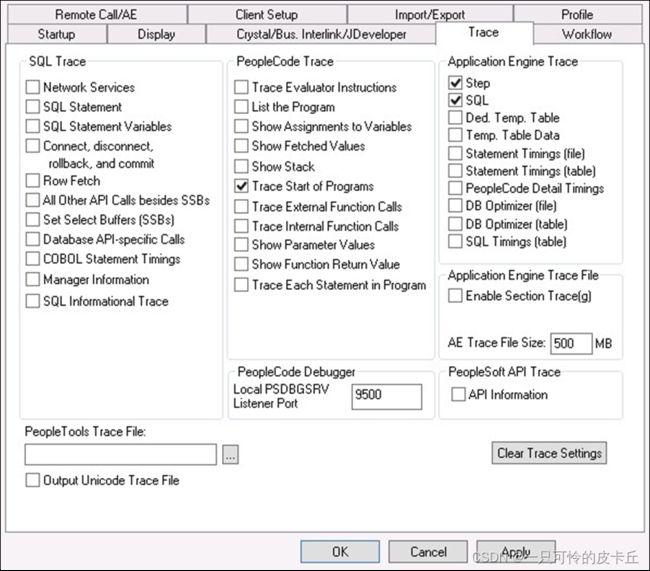
To set options in PeopleSoft Configuration Manager (two-tier mode):
要在PeopleSoft配置管理器中设置选项(两层模式):
- Start Configuration manager, and select the Trace tab.
启动配置管理器,然后选择跟踪选项卡。
- Under PeopleCode Trace, select Trace Start of Programs.
在“人物代码跟踪”下,选择“跟踪程序的开始”。
- Under Application Engine Trace, select Step and SQL.
在“应用程序引擎跟踪”下,选择“步骤和SQL”。
- Click either the Apply or OK button to set trace options.
单击“应用”或“确定”按钮以设置跟踪选项。
Related Links
“Understanding PeopleSoft Configuration Manager” (System and Server Administration)
“Starting PeopleSoft Configuration Manager” (System and Server Administration)
Locating Trace Files Step Traces SQL Traces
相关链接“了解PeopleSoft配置管理器”(系统和服务器管理)“启动PeopleSoft配置管理器”(系统和服务器管理)定位跟踪文件步骤跟踪SQL跟踪
Setting Options in Domain Configuration Files (three-tier mode)
在域配置文件中设置选项(三层模式)
To set options in domain configuration files of PeopleSoft Process Scheduler Administration (three-tier mode):
要在PeopleSoft Process Scheduler Administration(三级模式)的域配置文件中设置选项:
- Go to process scheduler configuration file.
转到进程调度程序配置文件。
- Set TraceSQL to 3 or above.
将TraceSQL设置为3或更高。
- Set TracePC to 64 or above.
将TracePC设置为64或更高。
Related Links
“Editing the PeopleSoft Process Scheduler Configuration File” (Process Scheduler) Locating Trace Files
相关链接编辑PeopleSoft进程调度器配置文件(进程调度程序)定位跟踪文件
Setting Options to Trace a Specific Application Engine Program
设置跟踪特定应用程序引擎程序的选项
To set options to trace a specific Application Engine program:
要设置跟踪特定应用程序引擎程序的选项,请执行以下操作:
- Select PeopleTools > Process Scheduler > Process Scheduler Processes. The Process Definitions page opens.
选择PeopleTools>进程调度器>进程调度器进程。“流程定义”页面将打开
- Select an existing value or add a new one.
选择一个现有值或添加一个新值。
- Select the Override Options tab.
选择覆盖选项选项卡。
The below image shows how to fill up the Override Options page to trace a specific Application Engine program:
下图显示如何填充"覆盖选项"页面以跟踪特定的应用程序引擎程序:

- From the Parameter List drop down list, select Append.
- Under Parameters for Parameter List, type -TRACE 7 -TOOLSTRACEPC 3652 TOOLSTRACESQL 131.
在参数列表的参数下,键入-TRACE 7 -TOOLSTRACEPC 3652-TOOLSTRACESQL 131。
- Click Update/Display
单击更新/显示
Related Links
Creating Process Definitions Locating Trace Files
相关链接创建进程定义定位跟踪文件