Python 全栈体系【四阶】(三)
第三章 matplotlib
一、基本绘图
1. 绘图核心 API
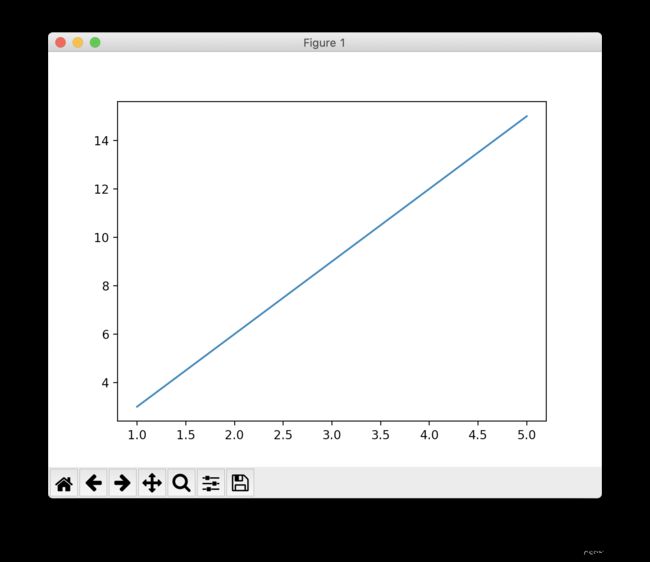
案例: 绘制简单直线
import numpy as np
import matplotlib.pyplot as plt

# 绘制简单直线
x = np.array([1, 2, 3, 4, 5])
y = np.array([3, 6, 9, 12, 15])

plt.plot(x, y)
plt.show() # 显示图片,阻塞方法
2. 设置线型、线宽

linestyle: 设置线型,常见取值有实线(‘-’)、虚线(‘–’)、点虚线(‘-.’)、点线(‘:’)
linewidth:线宽
color:颜色(red, blue, green)
- 英文单词: red blue green black oragered
- 字符串: #aabbcc
- 元组:
- (0.3,0.4,0.5) r,g,b
- (0.3,0.4,0.5,0.6) r,g,b,a
alpha: 设置透明度(0~1 之间)
案例:绘制正弦、余弦曲线,并设置线型、线宽、颜色、透明度
# 绘制正弦曲线
import numpy as np
import matplotlib.pyplot as plt
import math

x = np.arange(0, 2 * np.pi, 0.1)  # 以0.1为单位,生成0~6的数据
print(x)
y1 = np.sin(x)
y2 = np.cos(x)

# 绘制图形
plt.plot(x, y1, label="sin", linewidth=2)  # 实线,线宽2像素
plt.plot(x, y2, label="cos", linestyle="--", linewidth=4)  # 虚线,线宽4像素

plt.xlabel("x")  # x轴文字
plt.ylabel("y")  # y轴文字

# 设置坐标轴范围
plt.xlim(0, 2 * math.pi)
plt.ylim(-1, 2)

plt.title("sin & cos")  # 图标题
plt.legend()  # 图例
plt.show()
3. 设置坐标轴范围
语法:
#x_limt_min:	 x轴范围最小值
#x_limit_max:	 x轴范围最大值
plt.xlim(x_limt_min, x_limit_max)
#y_limt_min:	 y轴范围最小值
#y_limit_max:	 y轴范围最大值
plt.ylim(y_limt_min, y_limit_max)
4. 设置坐标刻度
语法:
#x_val_list: 	x轴刻度值序列
#x_text_list:	x轴刻度标签文本序列 [可选]
plt.xticks(x_val_list , x_text_list )  # [1,2,3,4,5]   [一,二,三,四,五]
#y_val_list: 	y轴刻度值序列
#y_text_list:	y轴刻度标签文本序列 [可选]
plt.yticks(y_val_list , y_text_list )
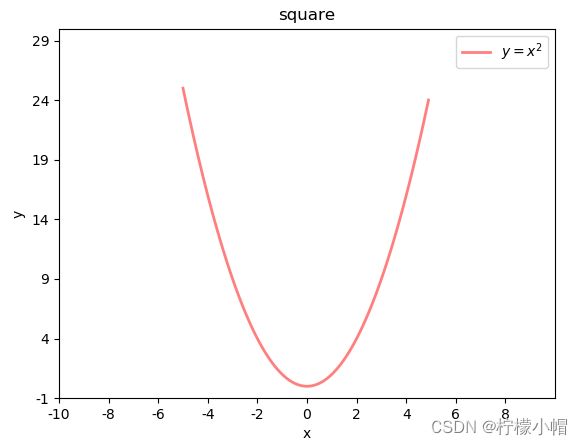
案例:绘制二次函数曲线
# 绘制二次函数曲线
import numpy as np
import matplotlib.pyplot as plt
import math

x = np.arange(-5, 5, 0.1)  # 以0.1为单位,生成-5~5的数据
print(x)
y = x ** 2

# 绘制图形
plt.plot(x, y, label="$y = x ^ 2$",
         linewidth=2,  # 线宽2像素
         color="red",  # 颜色
         alpha=0.5)  # 透明度

plt.xlabel("x")  # x轴文字
plt.ylabel("y")  # y轴文字

# 设置坐标轴范围
plt.xlim(-10, 10)
plt.ylim(-1, 30)

# 设置刻度
x_tck = np.arange(-10, 10, 2)
x_txt = x_tck.astype("U")
plt.xticks(x_tck, x_txt)

y_tck = np.arange(-1, 30, 5)
y_txt = y_tck.astype("U")
plt.yticks(y_tck, y_txt)

plt.title("square")  # 图标题
plt.legend(loc="upper right")  # 图例 upper right, center
plt.show()
刻度文本的特殊语法 – LaTex 排版语法字符串
r'$x^n+y^n=z^n$',   r'$\int\frac{1}{x} dx = \ln |x| + C$',     r'$-\frac{\pi}{2}$'

r'$latex表达式$'

r''  原生字符串     字符串当中的任何内容都不进行转义

\pi
\frac{分子}{分母}
r'$\frac{\pi}{2}$'
x n + y n = z n , ∫ 1 x d x = ln ∣ x ∣ + C , − π 2 x^n+y^n=z^n, \int\frac{1}{x} dx = \ln |x| + C, -\frac{\pi}{2} xn+yn=zn,∫x1dx=ln∣x∣+C,−2π
5. 设置坐标轴
坐标轴名:left / right / bottom / top
# 获取当前坐标轴字典,{'left':左轴,'right':右轴,'bottom':下轴,'top':上轴 }
ax = plt.gca() #拿到当前的坐标系
# 获取其中某个坐标轴
axis = ax.spines['坐标轴名']
# 设置坐标轴的位置。 该方法需要传入2个元素的元组作为参数
# type:  移动坐标轴的参照类型  一般为'data' (以数据的值作为移动参照值)
# val:  参照值
axis.set_position(('data', val))
# 设置坐标轴的颜色
# color:  颜色值字符串
axis.set_color(color)  #无颜色:none
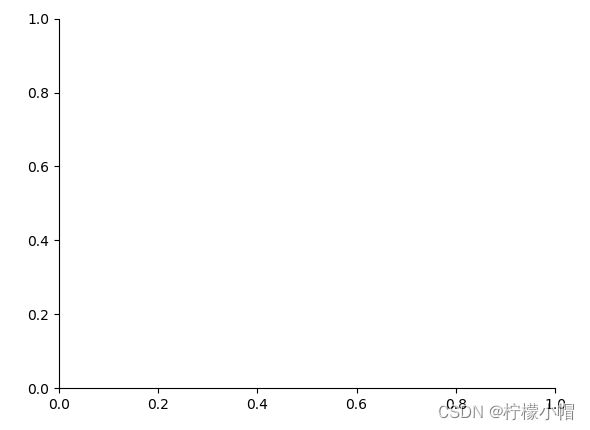
案例:设置坐标轴格式
# 设置坐标轴
import matplotlib.pyplot as plt

ax = plt.gca()
axis_b = ax.spines['bottom']  # 获取下轴
axis_b.set_position(('data', 0))  # 设置下轴位置, 以数据作为参照值

axis_l = ax.spines['left']  # 获取左轴
axis_l.set_position(('data', 0))  # 设置左轴位置, 以数据作为参照值

ax.spines['top'].set_color('none')  # 设置顶部轴无色
ax.spines['right'].set_color('none')  # 设置右部轴无色

plt.show()
6. 图例
显示两条曲线的图例,并测试 loc 属性。
描述这个图所画的内容
# 在绘制曲线时定义曲线的label
# label: <关键字参数 str> 支持LaTex排版语法字符串
plt.plot(xarray, yarray ... label='', ...)
# 设置图例的位置
# loc: <关键字参数> 指定图例的显示位置 (若不设置loc,则显示默认位置)
#	 ===============   =============
#    Location String   Location Code
#    ===============   =============
#    'best'            0
#    'upper right'     1
#    'upper left'      2
#    'lower left'      3
#    'lower right'     4
#    'right'           5
#    'center left'     6
#    'center right'    7
#    'lower center'    8
#    'upper center'    9
#    'center'          10
#    ===============   =============
plt.legend(loc='')

如果想要使用legend ,需要在plot画图的时候,指定参数label    可以写latex
7. 特殊点
语法:
# xarray: <序列> 所有需要标注点的水平坐标组成的序列
# yarray: <序列> 所有需要标注点的垂直坐标组成的序列
plt.scatter(xarray, yarray,
           marker='', 		#点型 ~ matplotlib.markers
           s='', 			#大小
           edgecolor='', 	#边缘色
           facecolor='',	#填充色
           zorder=3			#绘制图层编号 (编号越大,图层越靠上)
)
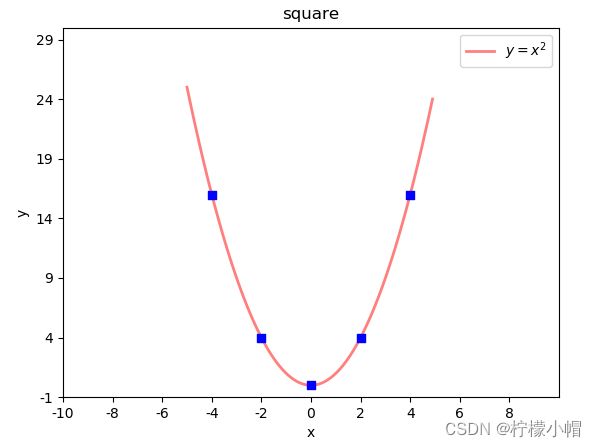
示例:在二次函数图像中添加特殊点
# 绘制特殊点
plt.scatter(x_tck,  # x坐标数组
            x_tck ** 2,  # y坐标数组
            marker="s",  # 点形状 s:square
            s=40,  # 大小
            facecolor="blue",  # 填充色
            zorder=3)  # 图层编号
marker 点型可参照:help(matplotlib.markers)
也可参照附录: matplotlib point 样式
二、高级绘图
语法:绘制两个窗口,一起显示。
# 手动构建 matplotlib 窗口
plt.figure(
    'sub-fig',					#窗口标题栏文本
    figsize=(4, 3),		#窗口大小 <元组>
	facecolor=''		#图表背景色
)
plt.show()
plt.figure 方法不仅可以构建一个新窗口,如果已经构建过 title='A’的窗口,又使用 figure 方法构建了 title=‘A’ 的窗口的话,mp 将不会创建新的窗口,而是把 title='A’的窗口置为当前操作窗口。
1. 设置当前窗口的参数
语法:测试窗口相关参数
# 设置图表标题 显示在图表上方
plt.title(title, fontsize=12)
# 设置水平轴的文本
plt.xlabel(x_label_str, fontsize=12)
# 设置垂直轴的文本
plt.ylabel(y_label_str, fontsize=12)
# 设置刻度参数   labelsize设置刻度字体大小
plt.tick_params(..., labelsize=8, ...)
# 设置图表网格线  linestyle设置网格线的样式
	#	-  or solid 粗线
	#   -- or dashed 虚线
	#   -. or dashdot 点虚线
	#   :  or dotted 点线
plt.grid(linestyle='')
# 设置紧凑布局,把图表相关参数都显示在窗口中
plt.tight_layout()
示例:绘制两个图像窗口
# 绘制两个图像窗口
import matplotlib.pyplot as plt

plt.figure("FigureA", facecolor="lightgray")
plt.grid(linestyle="-.")  # 设置网格线

plt.figure("FigureB", facecolor="gray")
plt.title('Figure BBB')
plt.xlabel("Date", fontsize=14)
plt.ylabel("Price", fontsize=14)
plt.grid(linestyle="--")  # 设置网格线
plt.tight_layout()  # 设置紧凑布局

plt.show()
2. 子图 :在一个窗口中,有多个图表
2.1 矩阵式布局(最常用的)
绘制矩阵式子图布局相关 API:
- 所有的图,都是规则的
- 所以的图的大小都是一样的
plt.figure('Subplot Layout', facecolor='lightgray')
# 拆分矩阵
	# rows:	行数
    # cols:	列数
    # num:	编号
plt.subplot(rows, cols, num)  3,3,5
	#	1 2 3
	#	4 5 6
	#	7 8 9
plt.subplot(3, 3, 5)		#操作3*3的矩阵中编号为5的子图
plt.subplot(335)			#简写
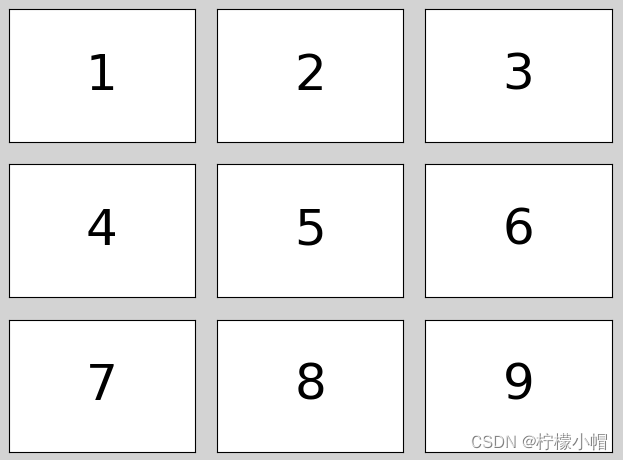
案例:绘制 9 宫格矩阵式子图,每个子图中写一个数字
plt.figure('Subplot Layout', facecolor='lightgray')

for i in range(9):
	plt.subplot(3, 3, i+1)
	plt.text(
		0.5, 0.5, i+1,
		ha='center',
		va='center',
		size=36,
		alpha=0.5,
		withdash=False
	)
	plt.xticks([])
	plt.yticks([])

plt.tight_layout()
plt.show()
执行结果:
2.2 网格式布局(很少使用)
网格式布局支持单元格的合并。
绘制网格式子图布局相关 API:
 plt.figure('Grid Layout', facecolor='lightgray')
# 调用GridSpec方法拆分网格式布局
# rows:	行数
# cols:	列数
# gs = mg.GridSpec(rows, cols)	拆分成3行3列
gs = plt.GridSpec(3, 3)	#创建网格对象
# 合并0行与0、1列为一个子图表
plt.subplot(gs[0, :2])    [行,列]
plt.text(0.5, 0.5, '1', ha='center', va='center', size=36)
plt.show()
案例:绘制一个自定义网格布局。
import matplotlib.gridspec as mg
plt.figure('GridLayout', facecolor='lightgray')
gridsubs = plt.GridSpec(3, 3)
# 合并0行、0/1列为一个子图
plt.subplot(gridsubs[0, :2])
plt.text(0.5, 0.5, 1, ha='center', va='center', size=36)
plt.tight_layout()
plt.xticks([])
plt.yticks([])
2.3 自由式布局(很少使用)
自由式布局相关 API:
plt.figure('Flow Layout', facecolor='lightgray')
# 设置图标的位置,给出左下角点坐标与宽高即可
# left_bottom_x: 坐下角点x坐标
# left_bottom_x: 坐下角点y坐标
# width:		 宽度
# height:		 高度
# plt.axes([left_bottom_x, left_bottom_y, width, height])

构建坐标系
plt.axes([0.03, 0.03, 0.94, 0.94]) x,y,width,height


plt.text(0.5, 0.5, '1', ha='center', va='center', size=36)
plt.show()
案例:测试自由式布局,定位子图。
plt.figure('FlowLayout', facecolor='lightgray')

plt.axes([0.1, 0.2, 0.5, 0.3])
plt.text(0.5, 0.5, 1, ha='center', va='center', size=36)
plt.show()
3. 散点图
画图简单,作用非常厉害。
可以通过每个点的坐标、颜色、大小和形状表示不同的特征值。
散点图可以直观的呈现一组数据的数值分布,从而可以更好的选择合适的数学模型来表达这组数据的数值分布规律。
| 身高 | 体重 | 性别 | 年龄段 | 种族 |
|---|---|---|---|---|
| 180 | 80 | 男 | 中年 | 亚洲 |
| 160 | 50 | 女 | 青少 | 美洲 |
绘制散点图的相关 API:
plt.scatter(
    x, 					# x轴坐标数组
    y,					# y轴坐标数组
    marker='', 			# 点型
    s=10,				# 大小
    color='',			# 颜色
    edgecolor='', 		# 边缘颜色
    facecolor='',		# 填充色
    zorder=''			# 图层序号
)


cmap
numpy.random 提供了 normal 函数用于产生符合 正态分布 的随机数
n = 100
# 172:	期望值  : 均值
# 10:	标准差 : 震荡幅度
# n:	数字生成数量
x = np.random.normal(172, 10, n)
y = np.random.normal(60, 10, n)


生成一组,期望值为172   标准差为10 的符合正态分布的样本
	142  -  202
案例:绘制平面散点图
# 散点图示例
import matplotlib.pyplot as plt
import numpy as np

n = 40
# 期望值:期望值是该变量输出值的平均数
# 标准差:是反映一组数据离散程度最常用的一种量化形式,是表示精确度的重要指标
x = np.random.normal(172, 20 ,n ) # 期望值, 标准差, 生成数量
y = np.random.normal(60, 10, n) # 期望值, 标准差, 生成数量

x2 = np.random.normal(180, 20 ,n ) # 期望值, 标准差, 生成数量
y2 = np.random.normal(70, 10, n) # 期望值, 标准差, 生成数量

plt.figure("scatter", facecolor="lightgray")
plt.title("Scatter Demo")
plt.scatter(x, y, c="red", marker="D")
plt.scatter(x2, y2, c="blue", marker="v")

plt.xlim(100, 240)
plt.ylim(0, 100)
plt.show()
4. 填充
以某种颜色自动填充两条曲线的闭合区域。
plt.fill_between(
	x,				# x轴的水平坐标
    sin_x,			# 下边界曲线上点的垂直坐标
    cos_x,			# 上边界曲线上点的垂直坐标
    sin_x<cos_x, 	# 填充条件,为True时填充
    color='', 		# 填充颜色
    alpha=0.2		# 透明度
)
案例:绘制两条曲线: sin_x = sin(x) cos_x = cos(x / 2) / 2 [0-8π]
import matplotlib.pyplot as plt
import numpy as np

n = 1000
x = np.linspace(0, 8 * np.pi, n)  # 返回指定间隔上的等距数字
sin_y = np.sin(x)  # 计算sin函数值
cos_y = np.cos(x / 2) / 2  # 计算cos函数值

plt.figure('Fill', facecolor='lightgray')
plt.title('Fill', fontsize=20)
plt.xlabel('x', fontsize=14)  # x轴标签
plt.ylabel('y', fontsize=14)  # y轴
plt.tick_params(labelsize=10)  # 刻度
plt.grid(linestyle=':')

plt.plot(x, sin_y, c='dodgerblue', label=r'$y=sin(x)$')
plt.plot(x, cos_y, c='orangered', label=r'$y=\frac{1}{2}cos(\frac{x}{2})$')

# 填充cos_y < sin_y的部分
plt.fill_between(x, cos_y, sin_y, cos_y < sin_y, color='dodgerblue', alpha=0.5)
# 填充cos_y > sin_y的部分
plt.fill_between(x, cos_y, sin_y, cos_y > sin_y, color='orangered', alpha=0.5)

plt.legend()
plt.show()
5. 条形图(柱状图)
绘制柱状图的相关 API: (bar)
# 设置使中文显示完整
plt.rcParams['font.sans-serif']=['SimHei'] #设置中文显示完整
plt.rcParams['axes.unicode_minus']=False #设置正常显示标点符号


plt.figure('Bar', facecolor='lightgray')

plt.bar(
	x,				# 水平坐标数组
    y,				# 柱状图高度数组
    width,			# 柱子的宽度
    color='', 		# 填充颜色
    label='',		#
    alpha=0.2		#
)

legend
案例:先以柱状图绘制苹果 12 个月的销量,然后再绘制橘子的销量
                                                                             import matplotlib.pyplot as plt
import numpy as np

apples = np.array([30, 25, 22, 36, 21, 29, 20, 24, 33, 19, 27, 15])
oranges = np.array([24, 33, 19, 27, 35, 20, 15, 27, 20, 32, 20, 22])

plt.figure('Bar', facecolor='lightgray')
plt.title('Bar', fontsize=20)
plt.xlabel('Month', fontsize=14)
plt.ylabel('Price', fontsize=14)
plt.tick_params(labelsize=10)
plt.grid(axis='y', linestyle=':')
plt.ylim((0, 40))

x = np.arange(len(apples))  # 产生均匀数组,长度等同于apples

plt.bar(x - 0.2,  # 横轴数据
       apples,  # 纵轴数据
       0.4,  # 柱体宽度
       color='dodgerblue',
       label='Apple')
plt.bar(x + 0.2,  # 横轴数据
       oranges,  # 纵轴数据
       0.4,  # 柱体宽度
       color='orangered', label='Orange', alpha=0.75)

plt.xticks(x, ['Jan', 'Feb', 'Mar', 'Apr', 'May', 'Jun', 'Jul', 'Aug', 'Sep', 'Oct', 'Nov', 'Dec'])

plt.legend()
plt.show()
6. 直方图
执行结果:
图像数值化处理技术:
-
灰度图像:二维数组 一个值表示一个像素的颜色
- 灰度级: 2 8 = 256 2^8 = 256 28=256 最暗到最亮一共能够分出来 256 个级别
- 0:最暗(黑色) 255 最亮(白色)
-
彩色图像:三维数组
直方图:数值分布的密度
绘制直方图相关 API:
plt.hist(
    x, 					# 值列表
    bins, 				# 直方柱数量
    color, 				# 颜色
    edgecolor 			# 边缘颜色
)


连续型
离散型
案例
import numpy as np
import matplotlib.pyplot as plt

data = np.random.normal(175, 5, 20000)
plt.hist(data, bins=100)
plt.show()

