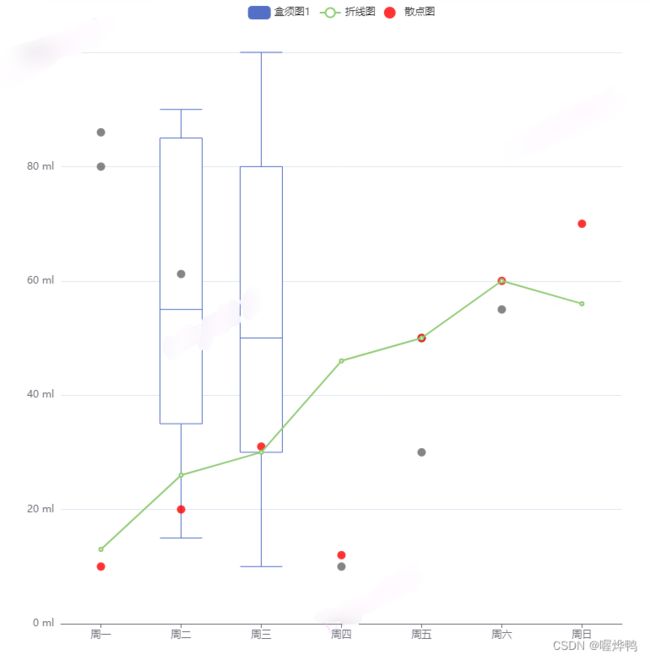
散点图,盒须图,折线图混放在一个echarts
option = {
            tooltip: {
                trigger: 'axis',
                axisPointer: {
                    type: 'cross',
                    crossStyle: {
                        color: '#999'
                    }
                }
            },
            legend: {
                data:['盒须图1','盒须图2','折线图','散点图']
            },
            xAxis: [
                {
                    type: 'category',
                    data: ['周一','周二','周三','周四','周五','周六','周日'],
                    axisPointer: {
                        type: 'shadow'
                    },
                    axisTick: {
                          alignWithLabel: true
                    }
                }
            ],
            yAxis: {
                    type: 'value',
                    min: 0,
                    max: 100,
                    position: 'left',
                    axisLabel: {
                        formatter: '{value} ml'
                    }
                },
            series: [
                {
                    name:'盒须图1',
                    type:'boxplot',
                    z:1,
                    data:[
                        [],//10, 30, 50, 80, 100
                        [15,35, 55, 85, 90],
                        [10, 30, 50, 80, 100],
                        [],
                        [],
                        [],[],
                    ]
                },

                {
                    name:'散点图4',
                    type:'scatter',
                    color:"#666",
                    data:[
                        [0,80],[0,86],[1,61.2],[3,10], [4,30], [4,50], [5,55]
                    ]
                },
                {
                    name:'折线图',
                    type:'line',
                    data:[13, 26, 30, 46, 50, 60, 56]
                },
                {
                    name:'散点图',
                    type:'scatter',
                    color:"#f00",
                    data: [
                        [0, 10],
                        [1, 20],
                        [2, 31],
                        [3, 12],
                        [4, 50],
                        [5, 60],
                        [6, 70]
                    ]
                }
            ]
        };
