echart图表导出
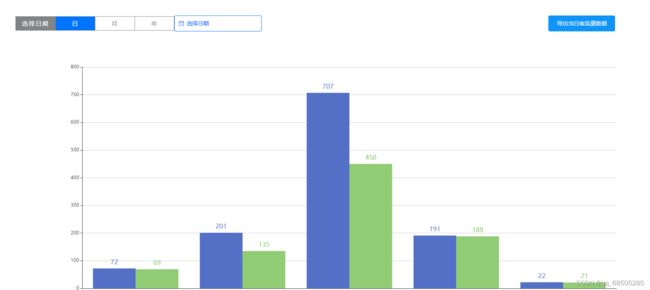
效果图:
1、安装并导入插件
注意:插件的版本号,版本号不一致可能也会导不出来
2、在utils文件夹新建一个js文件,文件里面封装方法
export const export_json_to_excel = ({
multiHeader = [],
header,
data,
filename,
merges = [],
autoWidth = true,
bookType = 'xlsx'
} = {}) => {
// 1. 设置文件名称
filename = filename || 'excel-list'
// 2. 把数据解析为数组,并把表头添加到数组的头部
data = [...data]
data.unshift(header)
// 3. 解析多表头,把多表头的数据添加到数组头部(二维数组)
for (let i = multiHeader.length - 1; i > -1; i--) {
data.unshift(multiHeader[i])
}
// 4. 设置 Excel 表工作簿(第一张表格)名称
var ws_name = 'SheetJS'
// 5. 生成工作簿对象
var wb = new Workbook()
// 6. 将 data 数组(json格式)转化为 Excel 数据格式
var ws = sheet_from_array_of_arrays(data)
// 7. 合并单元格相关(['A1:A2', 'B1:D1', 'E1:E2'])
if (merges.length > 0) {
if (!ws['!merges']) ws['!merges'] = []
merges.forEach((item) => {
ws['!merges'].push(XLSX.utils.decode_range(item))
})
}
// 8. 单元格宽度相关
if (autoWidth) {
/*设置 worksheet 每列的最大宽度*/
const colWidth = data.map((row) =>
row.map((val) => {
/*先判断是否为null/undefined*/
if (val == null) {
return {
wch: 10
}
} else if (val.toString().charCodeAt(0) > 255) {
/*再判断是否为中文*/
return {
wch: val.toString().length * 2
}
} else {
return {
wch: val.toString().length
}
}
})
)
/*以第一行为初始值*/
let result = colWidth[0]
for (let i = 1; i < colWidth.length; i++) {
for (let j = 0; j < colWidth[i].length; j++) {
if (result[j]['wch'] < colWidth[i][j]['wch']) {
result[j]['wch'] = colWidth[i][j]['wch']
}
}
}
ws['!cols'] = result
}
// 9. 添加工作表(解析后的 excel 数据)到工作簿
wb.SheetNames.push(ws_name)
wb.Sheets[ws_name] = ws
// 10. 写入数据
var wbout = XLSX.write(wb, {
bookType: bookType,
bookSST: false,
type: 'binary'
})
// 11. 下载数据
saveAs(
new Blob([s2ab(wbout)], {
type: 'application/octet-stream'
}),
`${filename}.${bookType}`
)
}
// [{}] ==> [[],[]]
export const dataTransform = (headers, data)=>{
return data.map(item=>{
return Object.keys(headers).map(key=>{
return item[headers[key]]
})
})
}
3、导入方法
![]()
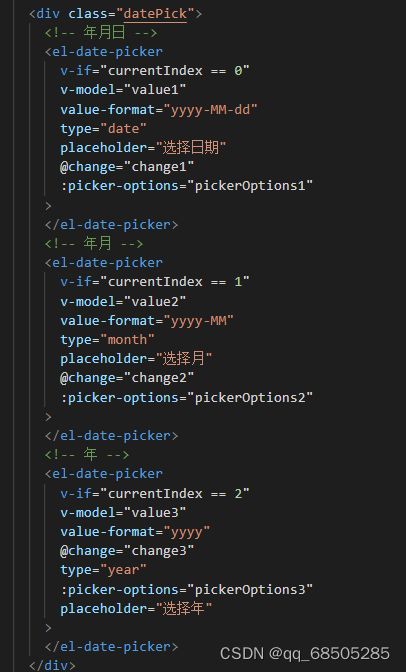
4、获取导出名字(对点击年月日的情况做判断)
getExportSheetName() {
switch (this.currentIndex) {
case 0:
if (this.value1) {
return `${this.value1}日客流量数据`
} else {
return `${getYearMothDay(new Date(), '-')}日客流量数据`
}
case 1:
if (this.value2) {
console.log(this.value2);
return `${this.value2}月客流量数据`
} else {
console.log(getYearMoth(new Date(), '-'));
return `${getYearMoth(new Date(), '-')}月客流量数据`
}
case 2:
if (this.value3) {
return `${this.value3}年客流量数据`
} else {
return `${new Date().getFullYear()}年客流量数据`
}
}
},
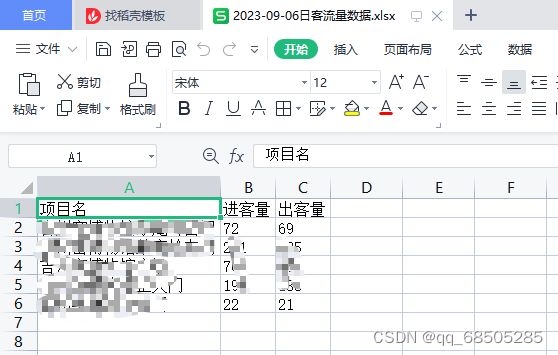
5、导出数据到excel表里
let ormProps = {
项目名: 'cameraName',
进客量: 'flowInNum',
出客量: 'flowOutNum'
}
let execelData = dataTransform(ormProps, this.statisData)
export_json_to_excel({
header: Object.keys(ormProps),
data: execelData,
filename: this.getExportSheetName()
})


