软件测试|如何用Python绘制雷达图
前言
我有朋友问我,他准备买车,预算20-25万,他在考虑几个车,说现在很难做出决定,让我帮他参谋参谋,该买哪个?
我只能问,你考虑的是哪几款车?
我朋友提出了下列的名单,帕萨特,迈腾,凯美瑞,亚洲龙,天籁,雅阁。
说实话,这6款车都不错,是中级车市场的主流车型,没想到这小子混的是真不错。
那么我们应该如何提出我们的意见,我们在提出我们的意见之前,需要对各个车型做出对比,选出最符合我朋友要求的车型。那么指标这么多,我们要如何更直观的展示出来各个车型的优缺点,更便于他去选择,我决定绘制一个雷达图来给他展示这些各个车型的优缺点。
数据准备
选择买哪款车,我们主要考虑的有如下指标:舒适性,油耗,性能,安全,操控,这就开始干,根据我们在汽车之家上查到的数据给各个车型赋予分数,如下:
# 分别为帕萨特,迈腾,凯美瑞,亚洲龙,天籁,雅阁
stats = [
    {"舒适性": 85, "油耗": 75, "性能": 90, "安全": 70, "操控": 90},
    {"舒适性": 87, "油耗": 72, "性能": 95, "安全": 75, "操控": 95},
    {"舒适性": 80, "油耗": 95, "性能": 70, "安全": 85, "操控": 80},
    {"舒适性": 85, "油耗": 90, "性能": 75, "安全": 85, "操控": 75},
    {"舒适性": 85, "油耗": 85, "性能": 80, "安全": 80, "操控": 85},
    {"舒适性": 75, "油耗": 90, "性能": 82, "安全": 85, "操控": 88},

]
绘制单车型雷达图
我们先绘制出单个车型的雷达图,比如我们要先绘制帕萨特的雷达图,我们的代码如下:
import numpy as np
import matplotlib.pyplot as plt

plt.rcParams['font.sans-serif'] = ['SimHei']  # 显示中文
plt.rcParams['axes.unicode_minus'] = False  # 正常显示负号

stats = [
    {"舒适性": 85, "油耗": 75, "性能": 90, "安全": 70, "操控": 90},
    {"舒适性": 87, "油耗": 72, "性能": 95, "安全": 75, "操控": 95},
    {"舒适性": 80, "油耗": 95, "性能": 70, "安全": 85, "操控": 80},
    {"舒适性": 85, "油耗": 90, "性能": 75, "安全": 85, "操控": 75},
    {"舒适性": 85, "油耗": 85, "性能": 80, "安全": 80, "操控": 85},
    {"舒适性": 75, "油耗": 90, "性能": 82, "安全": 85, "操控": 88},

]
data_length = len(stats[0])
# 将极坐标根据数据长度进行等分
angles = np.linspace(0, 2 * np.pi, data_length, endpoint=False)
labels = [key for key in stats[0].keys()]
score = [[v for v in stat.values()] for stat in stats]
# 使雷达图数据封闭
score_a = np.concatenate((score[0], [score[0][0]]))
angles = np.concatenate((angles, [angles[0]]))
labels = np.concatenate((labels, [labels[0]]))
# 设置图形的大小
fig = plt.figure(figsize=(9, 9), dpi=100)
# 新建一个子图
ax = plt.subplot(111, polar=True)
# 绘制雷达图
ax.plot(angles, score_a, color='g')
# 设置雷达图中每一项的标签显示
ax.set_thetagrids(angles * 180 / np.pi, labels)
# 设置雷达图的0度起始位置
ax.set_theta_zero_location('N')  # E W S N SW SE NW NE
# 设置雷达图的坐标刻度范围
ax.set_rlim(0, 100)
# 设置雷达图的坐标值显示角度,相对于                                                                                                                                                                                                                                                                                                                                                                                            y               起始角度的偏移量
ax.set_rlabel_position(270)
ax.set_title("车型对比")
plt.legend(["帕萨特"], loc='best')
plt.show()
绘制出的雷达图如下所示:
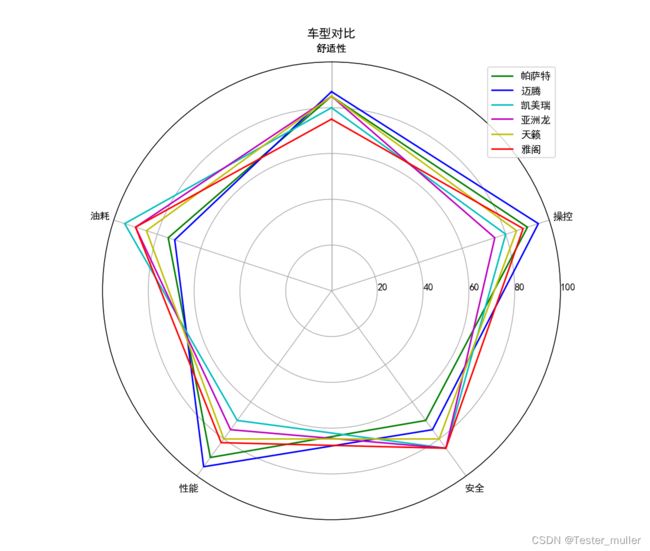
绘制全车型的雷达图
上方绘制单车型的雷达图我们可以知道,我们只读取了一个车型的数据,并且只绘制了一个车型的数据,我们现在要绘制上述6个车型的雷达图,需要读取全部6个车型的数据,并且绘制6个车型的雷达图,代码如下:
import numpy as np
import matplotlib.pyplot as plt

plt.rcParams['font.sans-serif'] = ['SimHei']  # 显示中文
plt.rcParams['axes.unicode_minus'] = False  # 正常显示负号

stats = [
    {"舒适性": 85, "油耗": 75, "性能": 90, "安全": 70, "操控": 90},
    {"舒适性": 87, "油耗": 72, "性能": 95, "安全": 75, "操控": 95},
    {"舒适性": 80, "油耗": 95, "性能": 70, "安全": 85, "操控": 80},
    {"舒适性": 85, "油耗": 90, "性能": 75, "安全": 85, "操控": 75},
    {"舒适性": 85, "油耗": 85, "性能": 80, "安全": 80, "操控": 85},
    {"舒适性": 75, "油耗": 90, "性能": 82, "安全": 85, "操控": 88},

]
data_length = len(stats[0])
# 将极坐标根据数据长度进行等分
angles = np.linspace(0, 2 * np.pi, data_length, endpoint=False)
labels = [key for key in stats[0].keys()]
score = [[v for v in stat.values()] for stat in stats]
# 使雷达图数据封闭
score_a = np.concatenate((score[0], [score[0][0]]))
score_b = np.concatenate((score[1], [score[1][0]]))
score_c = np.concatenate((score[2], [score[2][0]]))
score_d = np.concatenate((score[3], [score[3][0]]))
score_e = np.concatenate((score[4], [score[4][0]]))
score_f = np.concatenate((score[5], [score[5][0]]))
angles = np.concatenate((angles, [angles[0]]))
labels = np.concatenate((labels, [labels[0]]))
# 设置图形的大小
fig = plt.figure(figsize=(9, 9), dpi=100)
# 新建一个子图
ax = plt.subplot(111, polar=True)
# 绘制雷达图
ax.plot(angles, score_a, color='g')
ax.plot(angles, score_b, color='b')
ax.plot(angles, score_c, color='c')
ax.plot(angles, score_d, color='m')
ax.plot(angles, score_e, color='y')
ax.plot(angles, score_f, color='r')

# 设置雷达图中每一项的标签显示
ax.set_thetagrids(angles * 180 / np.pi, labels)
# 设置雷达图的0度起始位置
ax.set_theta_zero_location('N')  # E W S N SW SE NW NE
# 设置雷达图的坐标刻度范围
ax.set_rlim(0, 100)
# 设置雷达图的坐标值显示角度,相对于                                                                                                                                                                                                                                                                                                                                                                                            y               起始角度的偏移量
ax.set_rlabel_position(270)
ax.set_title("车型对比")
plt.legend(["帕萨特", "迈腾", "凯美瑞", "亚洲龙", "天籁", "雅阁"], loc='best')
plt.show()
绘制的图像如下:
进一步优化
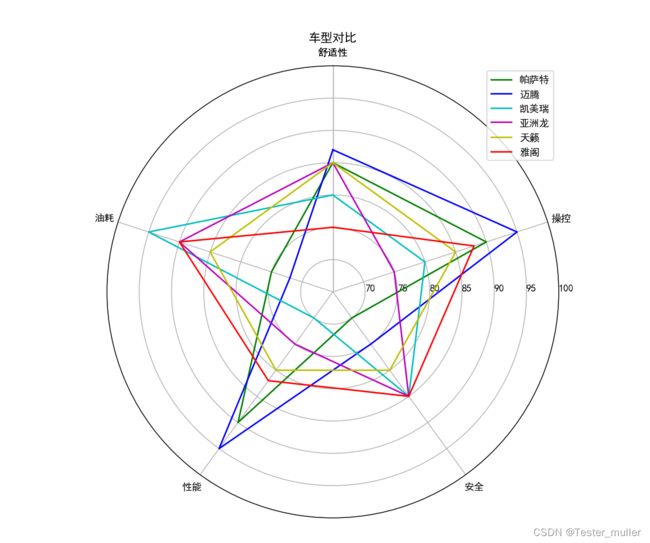
我们可以看到,上面绘制的雷达图,存在线条过于紧密的问题,让人眼花缭乱,我们能不能使得绘制的图不再那么紧密,显而易见,没有哪款车型的某项得分在65分以下,我们是否可以将刻度从65分开始呢,答案是可以的,我们只需要修改一下这一行代码即可,代码如下:
# 设置雷达图的坐标刻度范围
ax.set_rlim(65, 100)
修改代码后重新绘制的雷达图如下:
总结
我们本篇文章主要借着替我朋友分析买哪款车好的契机,向大家介绍了使用matplotlib绘制雷达图的方法,包括对于雷达图的优化,下一篇文章,我们将介绍使用pyecharts库来绘制雷达图,看看是否会更加便捷。最后,我朋友家拆迁了,并没有买这么便宜的车型,他直接买了我的梦想——保时捷帕纳梅拉。
更多技术文章


