ECharts的颜色渐变
目录
一、直接配置参数实现颜色渐变
二、使用ECharts自带的方法实现颜色渐变
一、两种渐变的实现方法
1、直接配置参数实现颜色渐变
横向的渐变: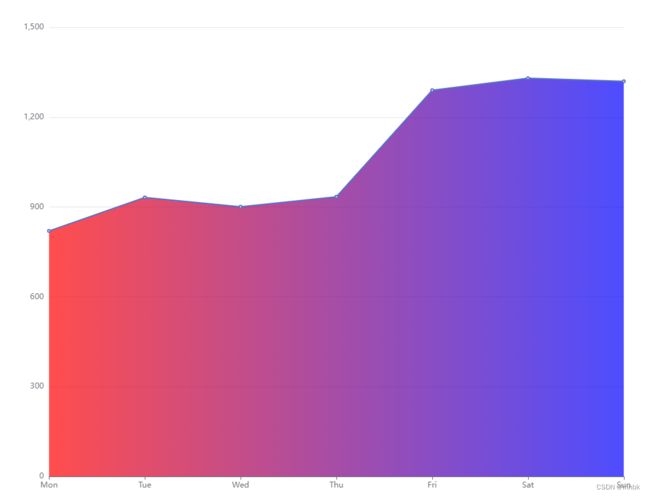
//主要代码
option = {
  xAxis: {
    type: 'category',
    boundaryGap: false,
    data: ['Mon', 'Tue', 'Wed', 'Thu', 'Fri', 'Sat', 'Sun']
  },
  yAxis: {
    type: 'value'
  },
  series: [
    {
      data: [820, 932, 901, 934, 1290, 1330, 1320],
      type: 'line',
//折线图区域 x->x2 表示横向  y->y2表示纵向 下面则是横向的渐变
      areaStyle: {color:{
                  type: 'linear',
                  x: 0,
                  y: 0,
                  x2: 1,
               y2: 0,
      colorStops: [{
      offset: 0, color: 'red' // 0% 处的颜色
  }, {
      offset: 1, color: 'blue' // 100% 处的颜色
  }],

}}
    }
  ]
};
若把y->y2改为0,1则表明是竖向的渐变
2、使用ECharts自带的方法实现颜色渐变
纵向的渐变:

使用new echarts.graphic.LinearGradient()方法
areaStyle: {
        //线性渐变,前4个参数分别是x0,y0,x2,y2(范围0~1);
        //相当于图形包围盒中的百分比。如果最后一个参数是‘true’,则该四个值是绝对像素位置。
           color: new echarts.graphic.LinearGradient( 0, 0, 0, 1,
               [
                {
                    offset: 0,
                    color: 'rgba(108, 255, 252, 0.8)', // 0% 处的颜色
                },
                {
                    offset: 1,
                    color: 'rgba(43, 205, 119, 0.8)', // 100% 处的颜色
                },
                   ],
                   false), //globalCoord为false,表示使用自身坐标系进行渐变。
            }