uChart折线图渐变及优化Y轴出现小数点
- 折线图渐变
首先解释一点,uChart中折线图不能够实现渐变,能够实现渐变的叫做区域图,所以先去检查一下你最外层的type值为’area’,而不是line,否则你再加extra里面的东西也不会显示的。
然后在最外层与xAxis平级添加extra,代码如下:
extra: {
		area: {
				type: "straight",
				opacity: 0.8,
				addLine: true,
				width: 2,
				gradient: true
			},
		},
以下是绘制该折线图(其实是区域图)的方法,完整配置如下:
  showLine(canvasId, chartData) {
	canvaLine = new uCharts({
			$this: _self,
			canvasId: canvasId,
			type: "area",//type为area而不是line
			legend: {
				show: false,
			},
			fontSize: 11,
			background: "#FFFFFF",
			pixelRatio: _self.pixelRatio,
			animation: true,
			categories: chartData.categories,
			series: chartData.series,
			padding: [14, 10, 4, 15],
			dataPointShape: false,
			duration: 500,
			xAxis: {
				disableGrid: true, //不绘制纵向网格
				fontColor: '#999999',
				axisLineColor: '#E6E6E6',
				fontSize: 9
			},
			yAxis: {
				gridColor: "#EBEBEB",
				gridType: "dash",
				dashLength: '3',
				data: [{
					fontColor: '#999999',
					min: this.getMin(),
					max: this.getMax(),
					axisLineColor: '#E6E6E6',
					fontSize: 9,
					format: (val) => {
						return val.toFixed(0) //此处为保留一位小数
					},
				}]
			},
			dataLabel: false, //是否在图表中显示数据标签内容值
			width: _self.cWidth * _self.pixelRatio,
			height: _self.cHeight * _self.pixelRatio,
			extra: {
				area: {
					type: "straight",
					opacity: 0.8,
					addLine: true,
					width: 2,
					gradient: true
				},
			},
		});
	},
- 优化Y轴出现小数点
我也不知道为什么uCharts会出现这个问题,但是我根据网上解决方案,将最大值设置成为我数据的最大值,最小值设置成我数据的最小值,然后给y轴数值保留0位小数。代码入下,顺便附上getMin、getMax方法
	yAxis: {
		gridColor: "#EBEBEB",
		gridType: "dash",
		dashLength: '3',
		data: [{
			fontColor: '#999999',
			min: this.getMin(),
			max: this.getMax(),
			axisLineColor: '#E6E6E6',
			fontSize: 9,
			format: (val) => {
				return val.toFixed(0) //此处为保留一位小数
			},
		}]
	},
	getMax(){
		return Math.max(...this.yData)
		},
		getMin(){
			return Math.min(...this.yData)
	},
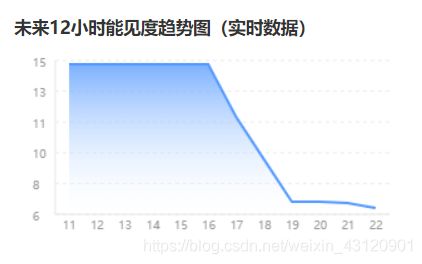
效果如图: