MATLAB 图像平滑实验
什么都无法舍弃的人,什么都无法得到。——《进击的巨人》
1.按照下面步骤完成空域图像平滑,比较分析 1)相同滤波方法,不同模版的处理效果;2)相同模版,不同滤波方法的处理效果。
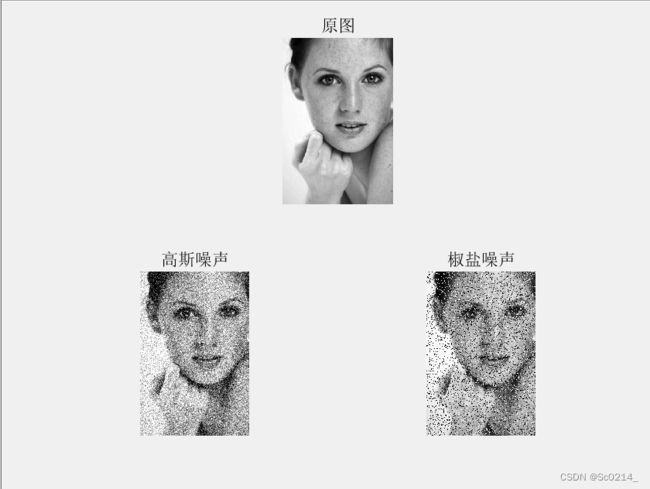
(1) 对一幅图像“girl.bmp”添加不同种类噪声:对给定的图像添加均值为 0,方差为 0.04 的高斯噪声,以及密度为 0.2 的椒盐噪声,显示添加噪声后的两幅图像。
I=imread('girl.bmp');
J=imnoise(I,'gaussian',0,0.04);%给图像添加高斯噪声
P=imnoise(I,'salt & pepper',0.2);%给图像添加椒盐噪声
subplot(2,2,[1 2]);
imshow(I);
title('原图');
subplot(2,2,3);
imshow(J);
title('高斯噪声');
subplot(2,2,4);
imshow(P);
title('椒盐噪声');
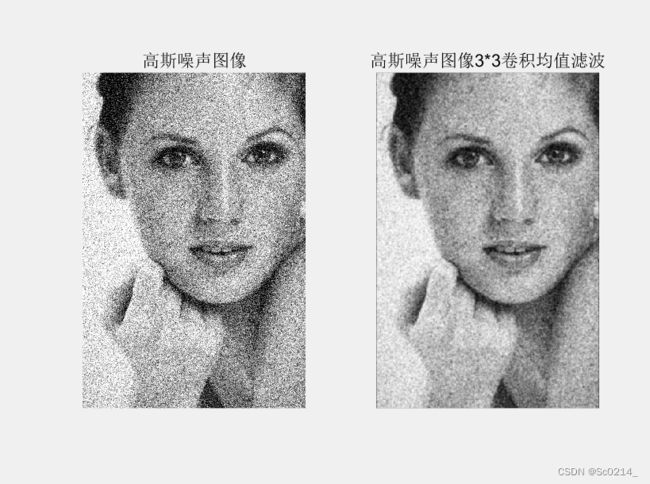
(2) 对上述两幅加噪图像分别进行 3×3、7×7 的均值滤波,使用“卷积”的滤波方式进行滤波,显示并比较滤波结果。
h1=fspecial('average');   %创建一个3×3均值滤波器
r1=imfilter(J,h1,'conv');%对高斯噪声图像3*3卷积均值滤波
subplot(1,2,1);
imshow(J);
title('高斯噪声图像');
subplot(1,2,2);
imshow(r1);
title('高斯噪声图像3*3卷积均值滤波');
r2=imfilter(P,h1,'conv');%对椒盐噪声图像3*3卷积均值滤波
subplot(1,2,1);
imshow(P);
title('椒盐噪声图像');
subplot(1,2,2);
imshow(r2);
title('椒盐噪声图像3*3卷积均值滤波');
h2=fspecial('average',7);%创建一个7×7均值滤波器
r3=imfilter(J,h2,'conv');%对高斯噪声图像7*7卷积均值滤波
subplot(1,2,1);
imshow(J);
title('高斯噪声图像');
subplot(1,2,2);
imshow(r3);
title('高斯噪声图像7*7卷积均值滤波');
r4=imfilter(P,h2,'conv');%对椒盐噪声图像7*7卷积均值滤波
subplot(1,2,1);
imshow(P);
title('椒盐噪声图像');
subplot(1,2,2);
imshow(r4);
title('椒盐噪声图像7*7卷积均值滤波');
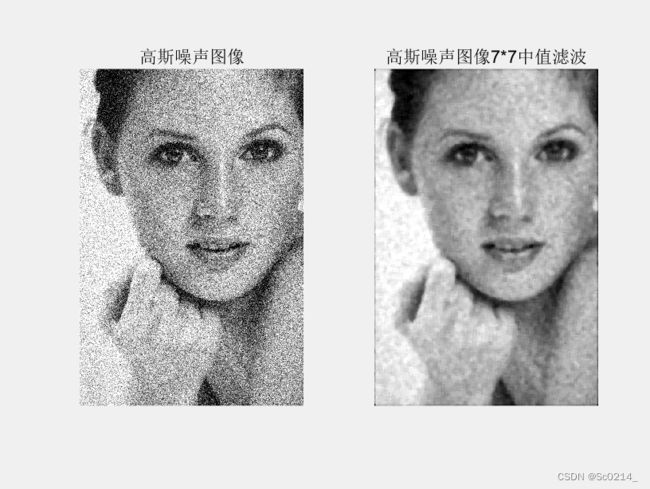
(3) 对上述两幅加噪图像分别进行 3×3、7×7 的中值滤波,显示并比较滤波结果。
r1=medfilt2(J,[3 3]);%对高斯噪声图像3*3中值滤波
r2=medfilt2(P,[3 3]);%对椒盐噪声图像3*3中值滤波
subplot(1,2,1);
imshow(J);
title('高斯噪声图像');
subplot(1,2,2);
imshow(r1);
title('高斯噪声图像3*3中值滤波');
subplot(1,2,1);
imshow(P);
title('椒盐噪声图像');
subplot(1,2,2);
imshow(r2);
title('椒盐噪声图像3*3中值滤波');
r3=medfilt2(J,[7 7]);%对高斯噪声图像7*7中值滤波
r4=medfilt2(P,[7 7]);%对椒盐噪声图像7*7中值滤波
subplot(1,2,1);
imshow(J);
title('高斯噪声图像');
subplot(1,2,2);
imshow(r3);
title('高斯噪声图像7*7中值滤波');
subplot(1,2,1);
imshow (P);
title('椒盐噪声图像');
subplot(1,2,2);
imshow(r4);
title('椒盐噪声图像7*7中值滤波');

2.基于 MATLAB 编程,首选实现对图像“Elaine.tiff”加入椒盐噪声(密度为默认值),然后对含噪图像进行截止频率 D0分别为 15、30 的巴特沃斯低通滤波,显示滤波结果,如图 1 所示。
function [  ] = test83(  )
%UNTITLED 此处显示有关此函数的摘要
%   此处显示详细说明
I=im2double(imread('Elaine.tiff'));
subplot(221);imshow(I);title('原始图像')
Image=imnoise(I,'salt & pepper');
subplot(222);imshow(Image); title('椒盐噪声图像');

FImage=fftshift(fft2(Image));  %傅里叶变换及频谱中心化
[N,M]=size(FImage);
G=zeros(N,M);
a=floor(M/2);  b=floor(N/2); %定位频谱中心原点


d0=15; %截断频率D0=15
for x=1:M
   for y=1:N
       d=sqrt((x-a)^2+(y-b)^2); %点(x,y)到傅里叶频率原点(a,b)的距离
        H=1./(1+(d./d0).^4);         %设计巴特沃斯低通滤波器
       G(y,x)=H*FImage(y,x); %低通滤波处理
    end
end
g= real(ifft2(ifftshift(G)));
subplot(223);imshow(g);title('巴特沃斯低通滤波D0=15');

d0=30; %截断频率D0=30
for x=1:M
   for y=1:N
       d=sqrt((x-a)^2+(y-b)^2); %点(x,y)到傅里叶频率原点(a,b)的距离
        H=1./(1+(d./d0).^4);         %设计巴特沃斯低通滤波器
       G(y,x)=H*FImage(y,x); %低通滤波处理
    end
end
g= real(ifft2(ifftshift(G)));
subplot(224);imshow(g);title('巴特沃斯低通滤波D0=30');

end


