Python遥感图像处理指南(4)-质量波段和位掩码之影像云层信息提取
我们接着上一章的课程,本章继续开始图像处理分析。我们的最终目标是自动监测特定兴趣区域的反射光谱。这个区域可以是农作物、森林、湖泊或任何其他目标,目标是检查该区域光谱反射率随时间的变化情况,云层和阴影等不想要的像素可能会遮挡卫星传感器的视线,导致数据中出现噪音,或者像素可能因其他干扰而存在缺陷。这就是卫星质量评估QA波段的作用所在。
大多数光学卫星图像产品都带有一个或多个 QA 波段,允许用户评估每个像素的质量并提取满足其要求的像素。QA 波段最常见的应用是提取有关多云像素的信息并对其进行屏蔽。通常,QA 波段中包含的信息存储为按位标志。在这篇文章中,我将介绍与位运算相关的基本概念,以及如何使用位掩码提取和屏蔽特定的质量指标。
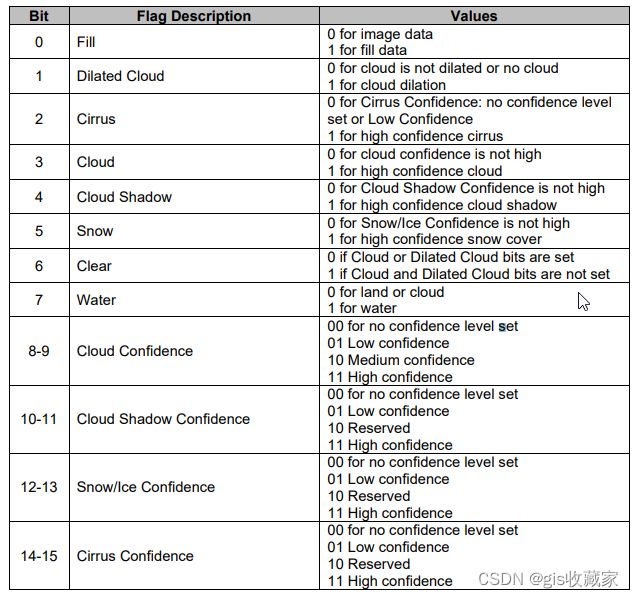
质量评估波段的各位掩码bitmask如下
1、打开质量评估波段
我们打开图像和 QA_PIXEL 波段。为此,我们将对 load_landsat_image 函数稍作修改。我们将从搜索字符串中排除"_SR_",这样它就能找到质量波段。
import numpy as np
import matplotlib.pyplot as plt
import rasterio
from pathlib import Path

def load_landsat_image(img_folder, bands):
    image = {}
    path = Path(img_folder)
    for band in bands:
        # considering the landsat images end with *_SR_B#.TIF, we will use it to locate the correct file
        file = next(path.glob(f'*{band}.tif'))
        print(f'Opening file {file}')
        ds = rasterio.open(file)
        image.update({band: ds.read(1)})

    return image

# load the image
img = load_landsat_image('D:/Images/Input/Landsat/LC08_L2SP_231062_20201026_20201106_02_T1/', ['B2', 'B3', 'B4', 'QA_PIXEL'])

img['QA_PIXEL']
array([[1, 1, 1, ..., 1, 1, 1],
[1, 1, 1, ..., 1, 1, 1],
[1, 1, 1, ..., 1, 1, 1],
...,
[1, 1, 1, ..., 1, 1, 1],
[1, 1, 1, ..., 1, 1, 1],
[1, 1, 1, ..., 1, 1, 1]], dtype=uint16)更多QA波段和位掩膜请参照这里
接下来直接看代码
mask_values = {
               'Dilated cloud over land': 21826,
               'Dilated cloud over water': 21890,
               'Mid conf Cloud': 22280,
               'High conf cloud shadow': 23888,
               'Wa