无线天气监视器(Raspberry Pi Pico & WizFi360 & Openweather
使用Raspberry Pi RP2040 & WizFi360通过openweather API在屏幕上显示天气信息(GC9A01)
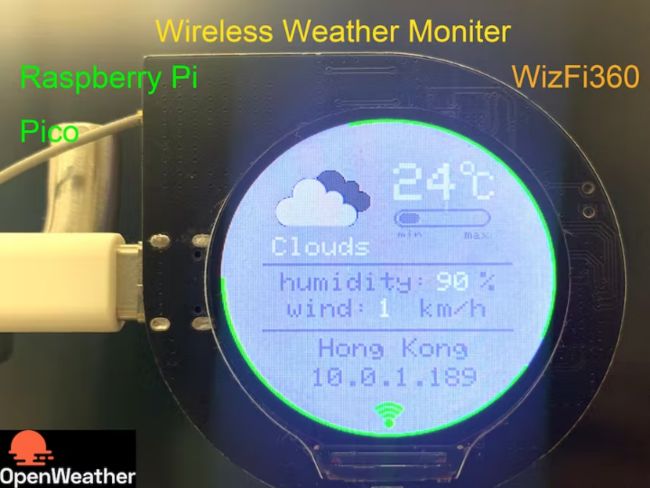
轉發: Wireless Weather Monitor(Raspberry Pi Pico & WizFi360 & Openweather)
项目介绍
我想在屏幕上显示天气状况,例如温度、湿度、风速等信息。
在这个项目中,我使用 openweather API 来获取当地的天气信息。
openweather的网站是 “https://openweathermap.org/api”.

openweather有多种API用于查询。 下图是一些API的介绍。
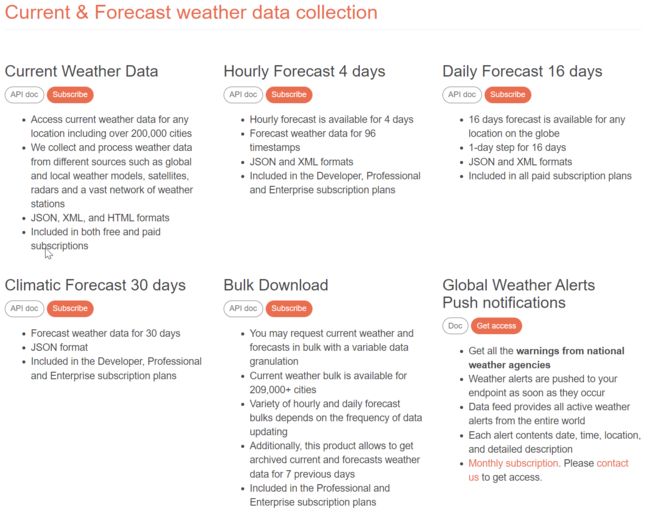
我这次使用的是“当前天气数据”,它可以访问包括超过200,000个城市在内的任何位置的当前天气数据,并以JSON格式回复。
我使用wizfi360作为http客户端来发送天气请求并获取天气参数。 WizFi360是一款WiFi模块,可以通过命令连接WiFi,并进行TCP或TCP(SSL)连接。 我用过很多次了,非常方便。
RP2040作为MCU,从wizfi360获取天气状况后,进行数据处理并将内容显示在屏幕上。
该项目分为四个步骤:
第1步:在openweather网站上创建新帐户并获取{API key};
Step2:在Arduino IDE中安装库文件和板卡支持;
步骤3:通过WizFi360从openweather API获取参数;
步骤4:在屏幕上显示天气状况(GC9A01);
以下是分步说明。
第1步:在openweather网站上创建新帐户并获取{API key}
创建新帐户并登录网站。 您可以找到您的 API 密钥。

请确认api密钥的状态已激活。

我使用的是免费账户服务,免费服务限制如下。
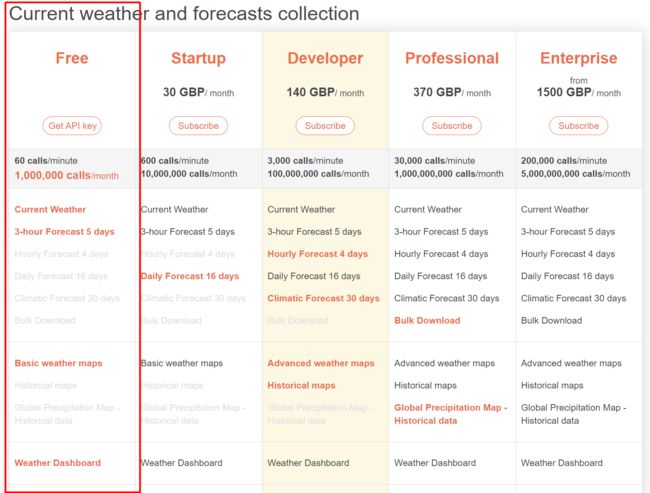
不过对于个人使用来说已经足够了。
Step2:在Arduino IDE中安装库文件和板卡支持
为 Arduino IDE 添加“WIZnet WizFi360-EVB-PICO”支持
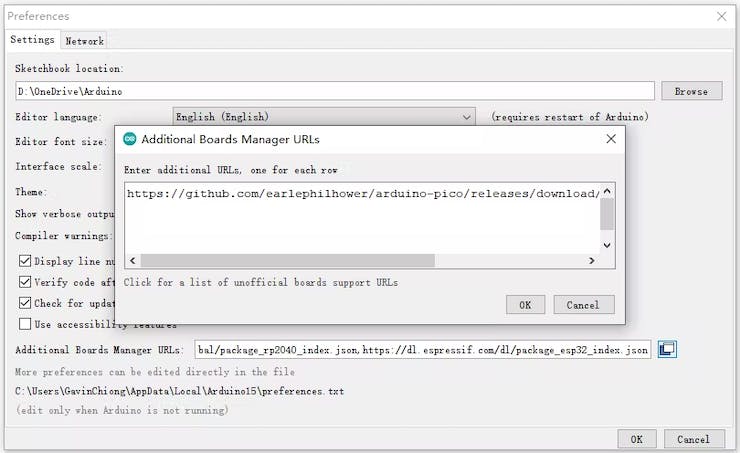
打开 Arduino IDE 并转到“文件”->“首选项”。
在弹出的对话框中,在“其他 Boards Manager URL”字段中输入以下 URL:
https://github.com/earlephilhower/arduino-pico/releases/download/global/package_rp2040_index.json
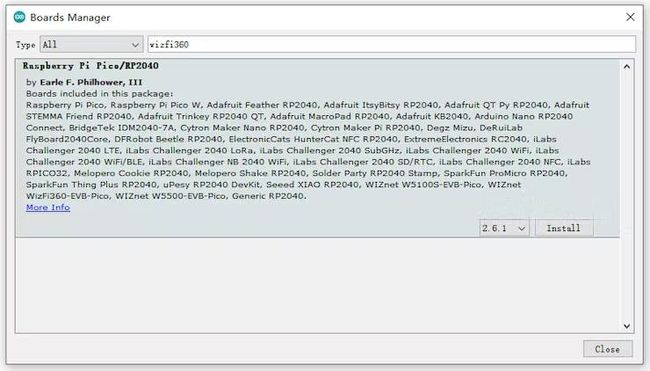
搜索“WizFi360”并通过“板管理器”安装板支持
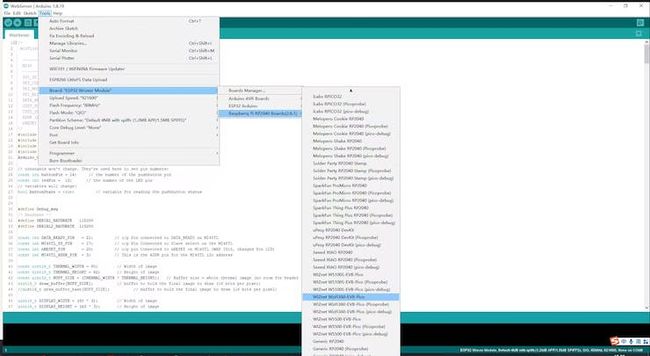
“工具->开发板:“***”-> Raspberry Pi RP2040 开发板(2.6.1) " 选择“WIZnet WizFi360-EVB-PICO”。
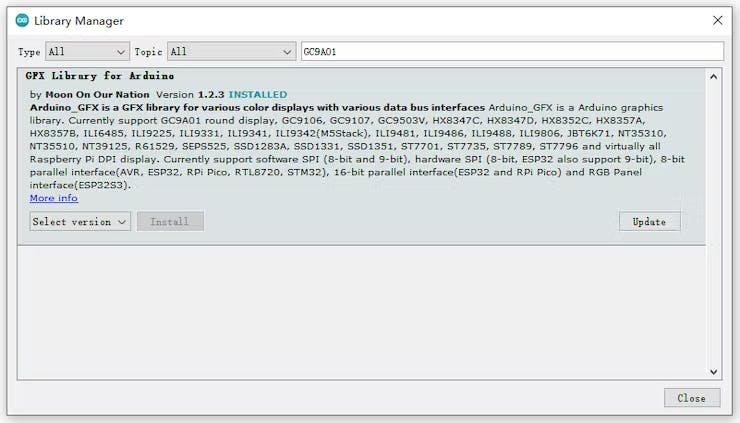
添加“GFX Library for rduino”,该库支持圆屏GC9A01。
步骤3:通过WizFi360从openweather API获取参数
#include "WizFi360.h"

// Wi-Fi info //
char ssid[] = "WIZNET_test";       // your network SSID (name)//
char pass[] = "********";          // your network password//
int status = WL_IDLE_STATUS;       // the Wifi radio's status//
WiFiServer server(5051);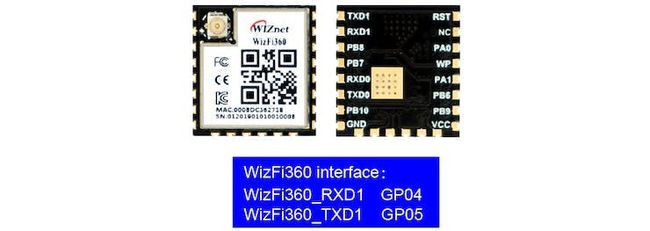
初始化WizFi360模块的串口,并将波特率更改为2000000bps(wizfi360的最大波特率)。
第一次初始化为115200,然后在WiZfi360库的初始化部分添加设置波特率(2000000),第二次改为2000000bps。
// initialize serial port for WizFi360 module//
#if defined(ARDUINO_WIZNET_WIZFI360_EVB_PICO)
  Serial2.begin(2000000);
  WiFi.init(&Serial2);
  Serial2.begin(2000000);
#endif
在“void setup()”中检查wizfi360 wifi的链接状态
// check for the presence of the shield//
  if (WiFi.status() == WL_NO_SHIELD) {
    Serial.println("WiFi shield not present");
    // don't continue//
    while (true);
  }
  // attempt to connect to WiFi network//
  while ( status != WL_CONNECTED) {
    Serial.print("Attempting to connect to WPA SSID: ");
    Serial.println(ssid);
    // Connect to WPA/WPA2 network//
    status = WiFi.begin(ssid, pass);
  }
  Serial.println("You're connected to the network");
在“openweathermap.org”的端口 80 上创建 TCP 套接字并向 API 发送请求。
case link_weather_server:
{
// if you get a connection, report back via serial
if (client.connect(weather_server,80)) {
Serial.println("Connected to server");
// Make a HTTP request
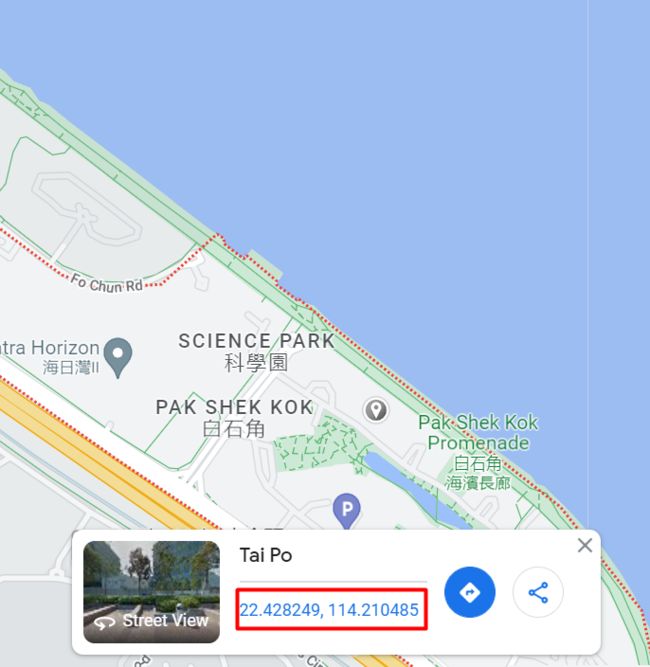
client.println(String("GET /data/2.5/weather?lat=22.428&lon=114.210&appid=") + String(weather_appid) + String(" HTTP/1.1"));
client.println(String("Host:") + String(weather_server));
client.println("Connection: close");
client.println();
data_now = 0;
}
currentState = get_weather_data;
}
break;api请求的格式及示例如下:
https://api.openweathermap.org/data/2.5/weather?lat={lat}&lon={lon}&appid={API 密钥}
其中{lat} {lon}为当地地理坐标,{API key}为步骤1中获取的密钥。
当地地理坐标可以在Google地图中查询,也可以通过API https://openweathermap.org/api/geocoding-api 获取。
之后wizFi360就可以获取API返回的天气信息JSON。
API 响应示例
{ "coord": { "lon": 10.99, "lat": 44.34 }, "weather": [ { "id": 501, "main": "Rain", "description": "moderate rain", "icon": "10d" } ], "base": "stations", "main": { "temp": 298.48, "feels_like": 298.74, "temp_min": 297.56, "temp_max": 300.05, "pressure": 1015, "humidity": 64, "sea_level": 1015, "grnd_level": 933 }, "visibility": 10000, "wind": { "speed": 0.62, "deg": 349, "gust": 1.18 }, "rain": { "1h": 3.16 }, "clouds": { "all": 100 }, "dt": 1661870592, "sys": { "type": 2, "id": 2075663, "country": "IT", "sunrise": 1661834187, "sunset": 1661882248 }, "timezone": 7200, "id": 3163858, "name": "Zocca", "cod": 200}各个参数的详细解释可在此页面查询:
“https://openweathermap.org/current”。
下面是参数解析过程。
case get_weather_data:
       {
          while (client.available()) {
            myBuffer.push(client.read());
            data_now =1;
          }
          if(data_now)
          {
            json_String = "";
            json_start = false;
            while (myBuffer.pop(value)) {
              //Serial.print((char)value);
              if(value == '{')
              {
                json_start = true;
              }
              if(json_start)
              {
                json_String += (char)value;
              }
            }
            dataStart = json_String.indexOf("icon") + strlen("icon") + 3;
            dataEnd = json_String.indexOf("}", dataStart) - 1;
            dataStr = json_String.substring(dataStart, dataEnd);
            weather_icon_num = dataStr;

            dataStart = json_String.indexOf("main") + strlen("main") + 3;
            dataEnd = json_String.indexOf(",", dataStart) - 1;
            dataStr = json_String.substring(dataStart, dataEnd);
            weather_main = dataStr;
            tft->fillRect(35,90,120,20,LIGHTGREY);
            tft->setTextColor(WHITE);
            if(weather_main.length()==4)
            {
              tft->setCursor(40, 90);
            }
            else
            {
              tft->setCursor(37, 90);
            }
            tft->setTextSize(2);
            tft->println(weather_main);

            dataStart = json_String.indexOf("temp") + strlen("temp") + 2;
            dataEnd = json_String.indexOf(".", dataStart);
            dataStr = json_String.substring(dataStart, dataEnd);
            weather_temperature = dataStr.toInt()-272;

            dataStart = json_String.indexOf("temp_min") + strlen("temp_min") + 2;
            dataEnd = json_String.indexOf(".", dataStart);
            dataStr = json_String.substring(dataStart, dataEnd);
            weather_temperature_min = dataStr.toInt()-272;

            dataStart = json_String.indexOf("temp_max") + strlen("temp_max") + 2;
            dataEnd = json_String.indexOf(".", dataStart);
            dataStr = json_String.substring(dataStart, dataEnd);
            weather_temperature_max = dataStr.toInt()-272;

            tft->drawRoundRect(129,72,64,8,5,LIGHTGREY);
            uint8_t temp_uint8 = (weather_temperature*64)/(100*(weather_temperature_max-weather_temperature_min));
            tft->fillRoundRect(129,72,temp_uint8,8,8,DARKGREY);

            tft->fillRect(125,34,45,30,LIGHTGREY);
            tft->setCursor(125, 34);
            tft->setTextSize(4);
            tft->println(weather_temperature);

            dataStart = json_String.indexOf("humidity") + strlen("humidity") + 2;
            dataEnd = json_String.indexOf(",", dataStart);
            dataStr = json_String.substring(dataStart, dataEnd);
            weather_humidity = dataStr.toInt();
            tft->fillRect(156,117,20,20,LIGHTGREY);
            tft->setTextColor(WHITE);
            tft->setTextSize(2);
            tft->setCursor(156, 117);
            tft->print(weather_humidity);

            dataStart = json_String.indexOf("speed") + strlen("speed") + 2;
            dataEnd = json_String.indexOf(",", dataStart)-1;
            dataStr = json_String.substring(dataStart, dataEnd);
            weather_wind = dataStr.toInt();
            tft->fillRect(113,137,30,20,LIGHTGREY);
            tft->setCursor(113, 137);
            tft->print(weather_wind);

            dataStart = json_String.indexOf("name") + strlen("name") + 3;
            dataEnd = json_String.indexOf("\"", dataStart);
            dataStr = json_String.substring(dataStart, dataEnd);
            weather_local = dataStr;

            client.stop();
            delay(500);
            data_now = 0;

            if(weather_icon_num.length()!=0)
            {
                currentState = link_icon_server;
            }else{
                currentState = link_weather_server;
            }
          }
       }
      break;
我们主要需要的是:
- Weather.main 天气参数组(雨、雪、极端天气等)
- Weather.icon 天气图标 ID
- main.temp 温度。 单位默认:开尔文,公制:摄氏度,英制:华氏度。
- main.humidity 湿度,%
- main.temp_min 当前最低温度。 这是目前观测到的最低温度(在大都市和城市地区)。 单位默认:开尔文,公制:摄氏度,英制:华氏度。
- main.temp_max 当前的最高温度。 这是目前观测到的最高温度(在大都市和城市地区)。 单位默认:开尔文,公制:摄氏度,英制:华氏度。
- 风速 风速。 单位默认:米/秒,公制:米/秒,英制:英里/小时。
其中“weather.icon”就是我们下面需要下载的图标文件。
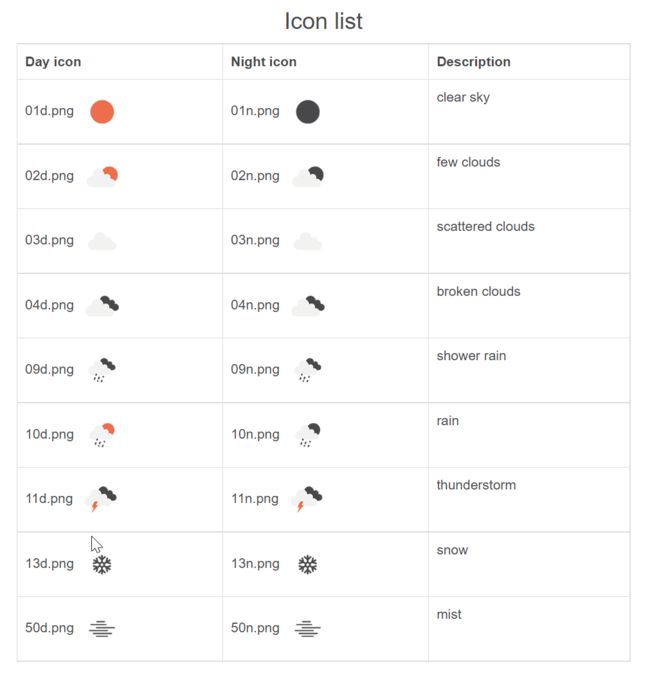
如何获取图标URL:
对于代码 500 - 小雨图标 =“10d”。 请参阅下面的完整代码列表
网址为 http://openweathermap.org/img/wn/[email protected]
case link_icon_server:
{
// if you get a connection, report back via serial
if (client.connect(weather_icon_server,80)) {
Serial.println("Connected to weather_icon_server");
// Make a HTTP request
//https://openweathermap.org/img/wn/[email protected]
//client.println(String("GET /img/wn/[email protected] HTTP/1.1")); //@2x 100px*100px
client.println(String("GET /img/wn/") + String(weather_icon_num) + String("@2x.png HTTP/1.1")); //@2x 100px*100px
//client.println(String("GET /img/wn/") + String(weather_icon_num) + String(".png HTTP/1.1"));
client.println(String("Host:") + String(weather_icon_server));
client.println("Connection: close");
client.println();
data_now = 0;
}
json_String = "";
currentState = get_weather_icon;
}
break;
case get_weather_icon: {
while (client.available()) {
json_String += (char)client.read();
data_now =1;
}
if(data_now)
{
dataStart = json_String.indexOf("Content-Length: ") + strlen("Content-Length: ");
dataEnd = json_String.indexOf("\n", dataStart);
dataStr = json_String.substring(dataStart, dataEnd);
weather_icon_len = dataStr.toInt();
dataStart = json_String.indexOf("Accept-Ranges: bytes")+ strlen("Accept-Ranges: bytes")+4;
dataStr = json_String.substring(dataStart, json_String.length());
uint16_t weather_icon_cnt;
weather_icon_cnt = weather_icon_len + dataStart - json_String.length();
while(weather_icon_cnt>0)
{
while(client.available()){
dataStr += (char)client.read();
weather_icon_cnt--;
}
}
client.stop();
data_now = 0;
currentState = display_status;
}
}
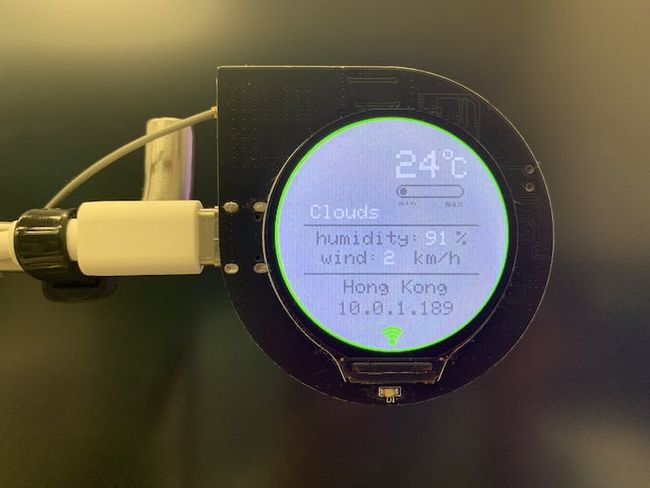
break;并在屏幕上显示如下:
case display_status:
       {
          int rc = png.openRAM((uint8_t *)dataStr.c_str(), weather_icon_len, PNGDraw);
          if (rc == PNG_SUCCESS) {
            char szTemp[256];
            sprintf(szTemp, "image specs: (%d x %d), %d bpp, pixel type: %d\n", png.getWidth(), png.getHeight(), png.getBpp(), png.getPixelType());
            Serial.print(szTemp);
            rc = png.decode(NULL, 0); // no private structure and skip CRC checking
            png.close();
          } // png opened successfully
          else
          {
            Serial.println("ERROR");
          }
          currentState = wait_timeout;
       }
      break;
步骤4:在屏幕上显示天气状况(GC9A01)
#include
Arduino_GFX *tft = create_default_Arduino_GFX();
在“libraries\GFX_Library_for_Arduino\src\Arduino_GFX_Library.h”中定义 GC9A01 使用的引脚
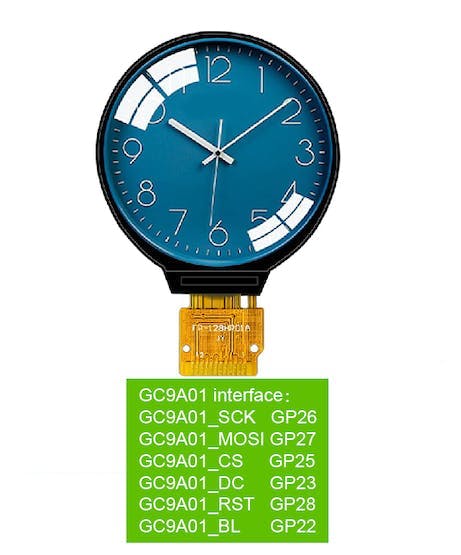
#elif defined(ARDUINO_RASPBERRY_PI_PICO)||defined(ARDUINO_WIZNET_WIZFI360_EVB_PICO)||defined(ARDUINO_WIZNET_5100S_EVB_PICO)
#define DF_GFX_SCK 26
#define DF_GFX_MOSI 27
#define DF_GFX_MISO GFX_NOT_DEFINED
#define DF_GFX_CS 25
#define DF_GFX_DC 23
#define DF_GFX_RST 28
#define DF_GFX_BL 22
在“void setup()”中初始化屏幕并打开屏幕背光
tft->begin();
  tft->fillScreen(BLACK);
  pinMode(22, OUTPUT);
  digitalWrite(22, HIGH);
  Display_Begin();
为了美观地显示界面,我们在“Setup()”期间编写了界面的框架。
void display_dashboard()
{
  //tft->fillRect(119,30,2,180,DARKGREY);
  tft->setCursor(173, 29);
  tft->setTextSize(2);
  tft->println("o");
  tft->setCursor(182, 41);
  tft->setTextSize(3);
  tft->println("C");
  tft->drawRoundRect(125,69,70,14,7,DARKGREY);
  tft->drawRoundRect(126,70,68,12,6,DARKGREY);
  tft->setTextColor(DARKGREY);
  tft->setTextSize(1);
  tft->setCursor(128, 85);
  tft->print("min     max");

  tft->fillRect(30,110,180,2,DARKGREY);
  tft->setTextColor(DARKGREY);
  tft->setTextSize(2);
  tft->setCursor(43, 117);
  tft->print("humidity:   %");
  tft->setCursor(48, 137);
  tft->print("wind:   km/h");
  tft->fillRect(30,160,180,2,DARKGREY);
  tft->setCursor(71, 167);
  tft->print("Hong Kong");
  tft->setCursor(65, 189);
  tft->print(ip);
  tft->fillArc(120,120, 118, 120, 0, 360, GREEN);
}
我们还需要在STEP3中显示得到的图标文件。 图标文件为PNG格式,PNG格式的显示部分如下:
// Function to draw pixels to the display
void PNGDraw(PNGDRAW *pDraw)
{
  uint16_t usPixels[240];
  uint8_t usMask[240];
  // Serial.printf("Draw pos = 0,%d. size = %d x 1\n", pDraw->y, pDraw->iWidth);
  png.getLineAsRGB565(pDraw, usPixels, PNG_RGB565_LITTLE_ENDIAN, 0x00000000);
  png.getAlphaMask(pDraw, usMask, 1);
  tft->draw16bitRGBBitmap(23, 10 + pDraw->y, usPixels, usMask, pDraw->iWidth, 1);
}
由于免费账户的限制,而且天气信息的变化不会太快,所以我设置为每5分钟重新获取一次数据,并且屏幕外缘有一个倒计时指示器。