使用python求函数极限的求解
例1:y=arctan( x1) 在x = 0 的左右极限。
解:编写Python代码如下:
import matplotlib.pyplot as plt
import numpy as np
import sympy as sp

# 求函数 y=arctan(1/x) 的左右极限
x = sp.Symbol('x')
fr = sp.atan(1 / x)
xl = sp.limit(fr, x, 0, dir='-')
xr = sp.limit(fr, x, 0, dir='+')
print('%s 左极限是:%s' % (str(fr), str(xl)))
print('%s 右极限是:%s' % (str(fr), str(xr)))
# 绘制函数 y=arctan(1/x) 的图像
x = np.arange(-6, 6, 0.01)
y = np.arctan(1 / x)
plt.title('y=arctan(1/x)')
plt.plot(x, y)
plt.show()
运行代码输出结果和绘制图像:
结果图:
根据计算结果和绘制的图像分析求得出题中函数的左右极限分别为− π/ 2 和π/2 。
例 2:两个重要极限limx→0xsin(x)=1 和limx→∞(1+x/1)平方x=e![]() 的验证。
的验证。
解:编写Python代码如下:
import matplotlib.pyplot as plt
import numpy as np
import sympy as sp

# 分析两个重要极限
x = sp.Symbol('x')
f1 = sp.sin(x) / x
f2 = (1 + 1 / x) ** x
x1 = sp.limit(f1, x, 0)
x2 = sp.limit(f2, x, 'oo')
print('%s 第一重要极限的值:%s' % (str(f1), str(x1)))
print('%s 第二重要极限的值:%s' % (str(f2), str(x2)))
# 绘制函数图像分析两个重要极限
x1 = np.arange(-3, 3, 0.01)
x2 = np.arange(0.01, 100, 0.1)
y1 = np.sin(x1) / x1
y2 = (1 + 1 / x2) ** x2
plt.figure(figsize=(12, 5))
plt.subplot(121)
plt.title('y=sin(x)/x')
plt.plot(x1, y1)
plt.subplot(122)
plt.title('y=(1+1/x)**x')
plt.plot(x2, y2)
plt.show()
运行代码输出结果和绘制图像:
根据上图变化趋势理解函数极限和程序得出的答案,验证两个重要极限。
import sympy
from sympy import oo
import numpy as np
import matplotlib.pyplot as plt

# 使用sympy第三方库计算出函数sin(x)/x在自变量x趋于无穷大时的极限值。
x = sympy.Symbol('x')
f = sympy.sin(x) / x
a = sympy.limit(f, x, oo)
print(a)
# 通过上面的代码可以计算出极限值为:0

# 然后通过第三方库numpy和matplotlib来将函数sin(x)/x图形绘制出来进行可视化
x = np.linspace(-1000, 1000)
y = np.sin(x) / x

plt.style.use(['seaborn-notebook'])
plt.plot(x, y, linewidth=1, color='b', linestyle=':', marker='.', markerfacecolor='b', markersize=8)
plt.xlabel('xlable', fontsize=16)  # x轴标题
plt.ylabel('ylable', fontsize=16)  # y轴标题
plt.title('Matplotlib Figure', fontsize=30)  # 图形标题
plt.show()
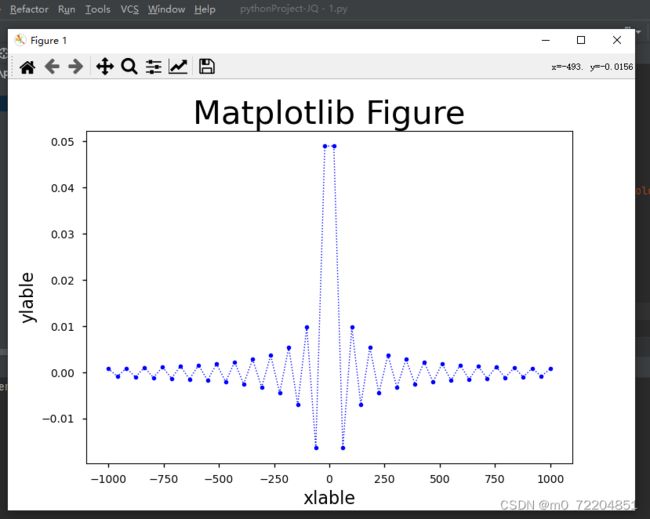
# 通过函数图形可以清楚看到函数sin(x)/x在区间[0->OO]上无限趋于0,所以极限为0
函数图形如下:


