Vue3+Echarts:堆积柱状图的绘制
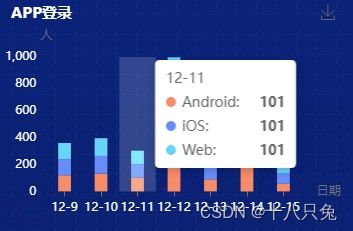
一、需求
二、实现
(关于Echarts的下载安装以及图表的样式设计,此处不展开!)
1、Templates部分
<template>
  <div class="login">
    <div class="chart" id="bar"></div>
  </div>
</template>
2、Script部分
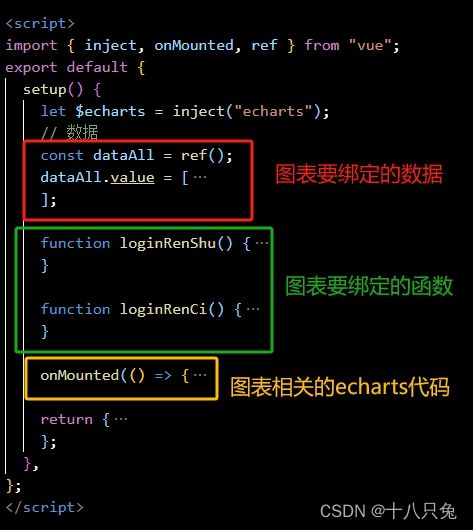
(1)总体逻辑
(2)图表数据
图表想要展示的指标是:最近一周APP在不同渠道的登陆人数,包括ios端、android端、网页端
- 使用ref来声明数据:
const dataAll = ref();
- 数据格式如下:
dataAll.value = [
  {
    id: 1,
    option1: "登录人数",
    data: [
      [12000, 13200, 10100, 13400, 9000, 23000, 21000],
      [22000, 18200, 19100, 23400, 29000, 33000, 31000],
      [22000, 18200, 19100, 23400, 29000, 33000, 31000],
    ],
  }
];
-
echarts核心代码
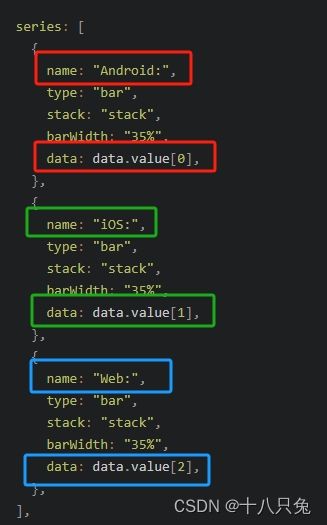
- 每个柱子包含三部分的数据,分别是android端的登录人数、ios端的登录人数以及pc端的登录人数;
- 因此series包含三个对象,分别代表三个渠道;
- 每个对象里面是每个渠道最近7天的登录人数
- echarts部分的完整代码:
onMounted(() => {
 let myChart = $echarts.init(document.getElementById("bar"));
 myChart.setOption({
   color: ["#f88c68", "#688CF8", "#68D4F8", "#8C68F8"],
   // 图表标题
   title: {
     text: "APP登录",
     textStyle: {
       //文字样式
       color: "#fff",
       fontSize: 15,
     },
     // 标题位置
     left: 0,
     top: 0,
   },

   // 网格grid:控制直角坐标系的布局和大小
   grid: {
     left: "12%",
     right: "12%",
     bottom: "10%",
     // containLabel: true
   },

   // 提示框
   tooltip: {
     trigger: "axis",
     axisPointer: {
       // 坐标轴指示器,坐标轴触发有效
       type: "shadow", // 默认为直线,可选为:'line' | 'shadow'
     },
   },

   // 工具栏
   toolbox: {
     feature: {
       saveAsImage: {}, //导出图片
     },
   },

   xAxis: {
     name: "日期", //x轴名称
     type: "category",
     data: ["12-9", "12-10", "12-11", "12-12", "12-13", "12-14", "12-15"],
     // 去除刻度线
     axisTick: {
       alignWithLabel: true,
     },
     // 对横轴刻度标签进行处理
     axisLabel: {
       //修改坐标系字体颜色
       // show: true,
       textStyle: {
         color: "#fff",
       },
       interval: 0,
       margin: 10,
       fontSize: "12",
     },
     axisLine: {
       show: false,
     },
   },

   yAxis: {
     name: "人", //x轴名称
     type: "value",
     splitLine: {
       show: false, //去掉折线图中的横线
     },
     // 去除刻度线
     axisTick: {
       show: false,
     },

     // 对横轴刻度标签进行处理
     axisLabel: {
       //修改坐标系字体颜色
       show: true,
       textStyle: {
         color: "#fff",
       },
       interval: 0,
       margin: 10,
     },
   },

   series: [
     {
       name: "Android:",
       type: "bar",
       stack: "stack",
       barWidth: "35%",
       data: data.value[0],
     },
     {
       name: "iOS:",
       type: "bar",
       stack: "stack",
       barWidth: "35%",
       data: data.value[1],
     },
     {
       name: "Web:",
       type: "bar",
       stack: "stack",
       barWidth: "35%",
       data: data.value[2],
     },
   ],
 });
});


