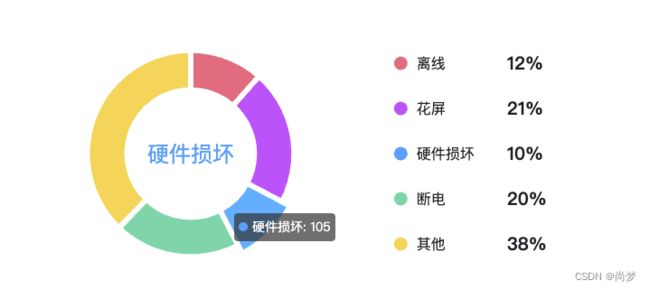
echart 饼图自动高亮

前言:

        自己的饼图已经创建完成。

效果图

echart 饼图自动高亮_第1张图片

代码:

     代码很简单就不用做过多的解释,看代码。下面代码直接复制就可以使用。

1.1 echart容器

1.2 数据

data() {
    return {
        charPie3currentIndex: 0,        // 工单类型统计-动画
        EchartTime: null,               // 工单类型统计-动画
        gdlxEcharts: null,              // 工单类型统计-Echarts实例
        // 工单类型统计
        gdlxtjData: [
                {
                    name: '离线',
                    value: 125,
                },
                {
                    name: '花屏',
                    value: 230,
                },
                {
                    name: '硬件损坏',
                    value: 105,
                },
                {
                    name: '断电',
                    value: 215,
                },
                {
                    name: '其他',
                    value: 410,
                }
        ],
    }
}

 1.3 代码

methods: {
    // 初始化工单类型统计Echarts
        initgdtypetjEcharts() {
            let _this = this;
            let total = 0;
            for (let i in _this.gdlxtjData) {
                let item = _this.gdlxtjData[i];
                total += item.value * 1;
            }
            this.gdlxEcharts = this.$echarts.init(document.getElementById("gdlxtjEcharts"));
            let options = {
                color: ['#E06C7D', '#BC52F9', '#5A9FF8', '#7FD5A9', '#F4D459'],
                legend: {
                    orient: "vartical",
                    x: "left",
                    top: "center",
                    left: "60%",
                    bottom: "0%",
                    icon: "pin",
                    itemGap: 30,
                    data: ['离线', '花屏', '硬件损坏', '断电', '其他'],
                    // data: this.gdlxtjData.map(item => item.name),
                    textStyle: {
                        rich: {
                            name: {
                                width: 100,
                                color: "#1D1F23",
                                fontWeight: 400,
                                fontSize: 16
                            },
                            num: {
                                color: "#1D1F23",
                                width: 40,
                                fontWeight: 600,
                                align: "left",
                                fontSize: 20
                            },
                        },
                    },
                    formatter: function (name) {
                        for (let i in _this.gdlxtjData) {
                            let item = _this.gdlxtjData[i];
                            if (name == item.name) {
                                return `{name|${item.name}}{num|${((item.value / total).toFixed(2)) * 100 + '%'}}`;
                            }
                        }
                    }
                },
                tooltip: {
                    trigger: 'item'
                },
                series: [
                    {
                        type: "pie",
                        clockwise: true, //饼图的扇区是否是顺时针排布
                        // minAngle: 2, //最小的扇区角度(0 ~ 360)
                        radius: ["40%", "65%"],
                        center: ["30%", "50%"],
                        avoidLabelOverlap: false,
                        itemStyle: {
                            //图形样式
                            normal: {
                                borderColor: "#ffffff",
                                borderWidth: 6,
                            },
                        },
                        label: {
                            normal: {
                                show: false,
                                position: "center",
                                rich: {
                                    text: {
                                        color: "#666",
                                        fontSize: 14,
                                        align: "center",
                                        verticalAlign: "middle",
                                        padding: 8,
                                    },
                                    value: {
                                        color: "#8693F3",
                                        fontSize: 24,
                                        align: "center",
                                        verticalAlign: "middle",
                                    },
                                },
                            },
                            emphasis: {
                                show: true,
                                textStyle: {
                                    fontSize: 24,
                                },
                            },
                        },
                        data: this.gdlxtjData,
                    },
                ],
            };
            this.gdlxEcharts.setOption(options);
            setTimeout(() => {
                window.addEventListener("resize", () => _this.gdlxEcharts.resize());
            }, 0);

            // 动画
            this.EchartTime = setInterval(() => {
                this.chartHover(options, _this.gdlxEcharts)
            }, 2000);
            // 鼠标移入
            this.gdlxEcharts.on('mouseover', function(param) {
                clearInterval(_this.EchartTime);    // 清除动画
                // 取消之前高亮的图形
                _this.gdlxEcharts.dispatchAction({
                    type: 'downplay',
                    seriesIndex: 0,
                    dataIndex: this.charPie3currentIndex
                })
                // 高亮当前图形
                _this.gdlxEcharts.dispatchAction({
                    type: 'highlight',
                    seriesIndex: 0,
                    dataIndex: param.dataIndex
                })
                // 显示 tooltip
                _this.gdlxEcharts.dispatchAction({
                    type: 'showTip',
                    seriesIndex: 0,
                    dataIndex: param.dataIndex
                })
            })
            // 鼠标移出
            this.gdlxEcharts.on('mouseout', function() {
                _this.gdlxEcharts.dispatchAction({
                    type: 'downplay',
                    seriesIndex: 0,
                    dataIndex: this.charPie3currentIndex
                })
                _this.EchartTime = setInterval(() => {
                    _this.chartHover(options, _this.gdlxEcharts)
                }, 2000);
            })
        },
        // 工单类型统计Echarts自动动画
        chartHover(options, echarts) {
            let dataLen = options.series[0].data.length;
            // 取消之前高亮的图形
            echarts.dispatchAction({
                type: 'downplay',
                seriesIndex: 0,
                dataIndex: this.charPie3currentIndex
            })
            this.charPie3currentIndex = (this.charPie3currentIndex + 1) % dataLen

            // 高亮当前图形
            echarts.dispatchAction({
                type: 'highlight',
                seriesIndex: 0,
                dataIndex: this.charPie3currentIndex
            })
            // 显示 tooltip
            echarts.dispatchAction({
                type: 'showTip',
                seriesIndex: 0,
                dataIndex: this.charPie3currentIndex
            })
        },
}

你可能感兴趣的:(vue.js,echarts,前端)