pyecharts调整X轴 以及在X轴可拖动
xAxis: [
    {
        type: 'category',
        data: result.weekListAndYear,//result.weekList,
        axisLabel:{
            //  interval: 0,  //控制坐标轴刻度标签的显示间隔.设置成 0 强制显示所有标签。设置为 1,隔一个标签显示一个标签。设置为2,间隔2个标签。以此类推
            rotate:45,//倾斜度 -90 至 90 默认为0
            textStyle:{
                fontWeight:"bold",  //加粗
                color:"#000000"   //黑色
            },
        },
    },
],
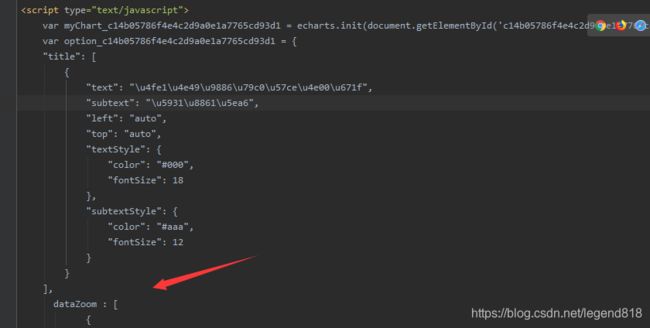
这个是X轴可以拖动
在这个位置添加的
	    dataZoom : [
	    	{
                type: 'slider',
                show: true,
                start: 94,
                end: 100,
                handleSize: 8
            },
            {
                type: 'inside',
                start: 94,
                end: 100
            },
            {
                type: 'slider',
                show: true,
                yAxisIndex: 0,
                filterMode: 'empty',
                width: 12,
                height: '70%',
                handleSize: 8,
                showDataShadow: false,
                left: '93%'
            }
	    ],
再来个官方的
option = {
   xAxis: {
       type: 'category',
       data: ['Mon', 'Tue', 'Wed', 'Thu', 'Fri', 'Sat', 'Sun']
   },
   dataZoom: [{
      type: 'slider',
      show: true,
      xAxisIndex: [0],
      left: '9%',
      bottom: -5,
      start: 10,
      end: 90 //初始化滚动条
  }],
   yAxis: {
       type: 'value'
   },
   series: [{
       data: [120, 200, 150, 80, 70, 110, 130],
       type: 'bar',
       barWidth:30,//设置柱状图宽度
   }]
};
