(10-2-02)贷款预测模型
请大家关注我,本文章粉丝可见,我会一直更新下去,完整代码进QQ群获取:323140750,大家一起进步、学习。
(15)计算数据集中"Self_Employed"列的一些统计信息,并将其打印出来。具体实现代码如下所示。
countNo = len(df[df.Self_Employed == 'No'])
countYes = len(df[df.Self_Employed == 'Yes'])
countNull = len(df[df.Self_Employed.isnull()])
print("Percentage of Not self employed: {:.2f}%".format((countNo / (len(df.Self_Employed))*100)))
print("Percentage of self employed: {:.2f}%".format((countYes / (len(df.Self_Employed))*100)))
print("Missing values percentage: {:.2f}%".format((countNull / (len(df.Self_Employed))*100)))
执行后输出:
Percentage of Not self employed: 81.43%
Percentage of self employed: 13.36%
Missing values percentage: 5.21%(16)计算"Credit_History"列中不同取值的数量,包括缺失值(NaN)。具体实现代码如下所示。
df.Credit_History.value_counts(dropna=False)
执行后输出:
1.0    475
0.0     89
NaN     50
Name: Credit_History, dtype: int64(17)使用Seaborn库创建了一个柱状图,用于可视化"Credit_History"列中不同取值的分布情况。具体实现代码如下所示。
sns.countplot(x="Credit_History", data=df, palette="viridis")
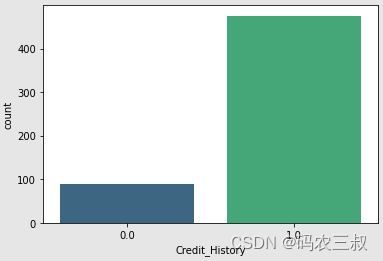
plt.show()执行效果如图10-5所示,这个柱状图可以帮助你直观地了解"Credit_History"列中各个取值(0和1)的数量分布情况。在这里,0表示坏的信用历史,1表示好的信用历史。
图10-5 征信记录效果图
(18)计算"Credit_History"列中不同取值的数量和缺失值的百分比,通过百分比的方式显示了好的信用历史、坏的信用历史和缺失值的比例。这有助于了解数据中信用历史的分布情况以及数据的完整性。具体实现代码如下所示。
count1 = len(df[df.Credit_History == 1])
count0 = len(df[df.Credit_History == 0])
countNull = len(df[df.Credit_History.isnull()])

print("Percentage of Good credit history: {:.2f}%".format((count1 / (len(df.Credit_History))*100)))
print("Percentage of Bad credit history: {:.2f}%".format((count0 / (len(df.Credit_History))*100)))
print("Missing values percentage: {:.2f}%".format((countNull / (len(df.Credit_History))*100)))执行后输出:
Percentage of Good credit history: 77.36%
Percentage of Bad credit history: 14.50%
Missing values percentage: 8.14%(19)计算"Property_Area"列中不同取值的数量,包括缺失值的百分比。这段代码的目的是了解不同地区属性在数据集中的分布情况,以便后续的数据分析和建模工作。具体实现代码如下所示。
df.Property_Area.value_counts(dropna=False)执行后输出:
Semiurban    233
Urban        202
Rural        179
Name: Property_Area, dtype: int64(20)使用库Seaborn创建一个计数图(countplot),展示了不同地区属性("Property_Area")在数据集中的分布情况。具体实现代码如下所示。
sns.countplot(x="Property_Area", data=df, palette="cubehelix")
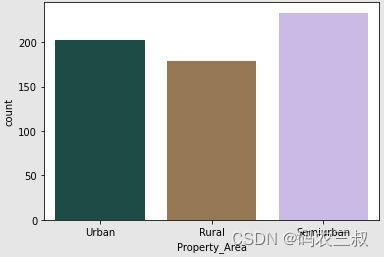
plt.show()执行效果如图10-6所示,以不同地区属性("Property_Area")为横坐标,纵坐标表示每个属性值在数据集中的计数。这样可以清晰地看到每个地区属性的数量分布情况。
图10-6 不同地区属性的分布图
(21)计算了不同地区属性("Property_Area")在数据集中的数量分布情况,并输出了各地区属性的百分比及缺失值的百分比。具体实现代码如下所示。
countUrban = len(df[df.Property_Area == 'Urban'])
countRural = len(df[df.Property_Area == 'Rural'])
countSemiurban = len(df[df.Property_Area == 'Semiurban'])
countNull = len(df[df.Property_Area.isnull()])

print("Percentage of Urban: {:.2f}%".format((countUrban / (len(df.Property_Area))*100)))
print("Percentage of Rural: {:.2f}%".format((countRural / (len(df.Property_Area))*100)))
print("Percentage of Semiurban: {:.2f}%".format((countSemiurban / (len(df.Property_Area))*100)))
print("Missing values percentage: {:.2f}%".format((countNull / (len(df.Property_Area))*100)))
执行后输出:
Percentage of Urban: 32.90%
Percentage of Rural: 29.15%
Percentage of Semiurban: 37.95%
Missing values percentage: 0.00%(22)计算贷款状态("Loan_Status")在数据集中的数量分布情况,并输出了贷款状态的百分比及缺失值的百分比。具体实现代码如下所示。
df.Loan_Status.value_counts(dropna=False)
执行后输出:
Y    422
N    192
Name: Loan_Status, dtype: int64(23)使用Seaborn库的countplot函数创建了一个柱状图,用于可视化贷款状态("Loan_Status")的分布情况。具体实现代码如下所示。
sns.countplot(x="Loan_Status", data=df, palette="YlOrBr")
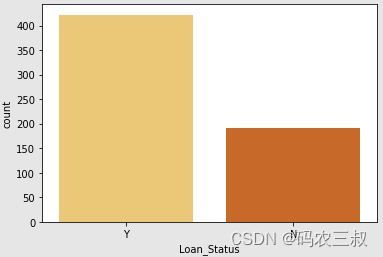
plt.show()执行效果如图10-7所示, 这个图表可以帮助你更清晰地了解贷款状态的分布情况,包括接受贷款("Y")和未接受贷款("N")的数量。
图10-7 贷款状态分布图
(24)计算贷款状态("Loan_Status")的统计信息,包括已批准的贷款数量、被拒绝的贷款数量以及缺失值的百分比。countY 统计了贷款状态为"Y"(已批准)的数量,countN 统计了贷款状态为"N"(被拒绝)的数量,countNull 统计了贷款状态中缺失值的数量。具体实现代码如下所示。
countY = len(df[df.Loan_Status == 'Y'])
countN = len(df[df.Loan_Status == 'N'])
countNull = len(df[df.Loan_Status.isnull()])

print("Percentage of Approved: {:.2f}%".format((countY / (len(df.Loan_Status))*100)))
print("Percentage of Rejected: {:.2f}%".format((countN / (len(df.Loan_Status))*100)))
print("Missing values percentage: {:.2f}%".format((countNull / (len(df.Loan_Status))*100)))
执行后输出:
Percentage of Approved: 68.73%
Percentage of Rejected: 31.27%
Missing values percentage: 0.00%(25)计算贷款期限("Loan_Amount_Term")的统计信息,包括不同期限的贷款数量以及缺失值的百分比。具体实现代码如下所示。
df.Loan_Amount_Term.value_counts(dropna=False)执行后输出:
360.0    512
180.0     44
480.0     15
NaN       14
300.0     13
240.0      4
84.0       4
120.0      3
60.0       2
36.0       2
12.0       1
Name: Loan_Amount_Term, dtype: int64(26)使用Seaborn库创建一个柱状图,用于可视化贷款期限("Loan_Amount_Term")的分布情况。具体实现代码如下所示。
sns.countplot(x="Loan_Amount_Term", data=df, palette="rocket")
plt.show()执行效果如图10-8所示,通过这个图形,可以清晰地看到不同期限的贷款在数据中的分布情况,有助于进一步的数据分析和理解。
图10-8 贷款期限分布图
(27)计算数据集中贷款期限("Loan_Amount_Term")的不同取值在数据集中的出现次数,并计算了每个期限值的百分比以及缺失值的百分比。具体实现代码如下所示。
count12 = len(df[df.Loan_Amount_Term == 12.0])
count36 = len(df[df.Loan_Amount_Term == 36.0])
count60 = len(df[df.Loan_Amount_Term == 60.0])
count84 = len(df[df.Loan_Amount_Term == 84.0])
count120 = len(df[df.Loan_Amount_Term == 120.0])
count180 = len(df[df.Loan_Amount_Term == 180.0])
count240 = len(df[df.Loan_Amount_Term == 240.0])
count300 = len(df[df.Loan_Amount_Term == 300.0])
count360 = len(df[df.Loan_Amount_Term == 360.0])
count480 = len(df[df.Loan_Amount_Term == 480.0])
countNull = len(df[df.Loan_Amount_Term.isnull()])

print("Percentage of 12: {:.2f}%".format((count12 / (len(df.Loan_Amount_Term))*100)))
print("Percentage of 36: {:.2f}%".format((count36 / (len(df.Loan_Amount_Term))*100)))
print("Percentage of 60: {:.2f}%".format((count60 / (len(df.Loan_Amount_Term))*100)))
print("Percentage of 84: {:.2f}%".format((count84 / (len(df.Loan_Amount_Term))*100)))
print("Percentage of 120: {:.2f}%".format((count120 / (len(df.Loan_Amount_Term))*100)))
print("Percentage of 180: {:.2f}%".format((count180 / (len(df.Loan_Amount_Term))*100)))
print("Percentage of 240: {:.2f}%".format((count240 / (len(df.Loan_Amount_Term))*100)))
print("Percentage of 300: {:.2f}%".format((count300 / (len(df.Loan_Amount_Term))*100)))
print("Percentage of 360: {:.2f}%".format((count360 / (len(df.Loan_Amount_Term))*100)))
print("Percentage of 480: {:.2f}%".format((count480 / (len(df.Loan_Amount_Term))*100)))
print("Missing values percentage: {:.2f}%".format((countNull / (len(df.Loan_Amount_Term))*100)))
执行后输出:
Percentage of 12: 0.16%
Percentage of 36: 0.33%
Percentage of 60: 0.33%
Percentage of 84: 0.65%
Percentage of 120: 0.49%
Percentage of 180: 7.17%
Percentage of 240: 0.65%
Percentage of 300: 2.12%
Percentage of 360: 83.39%
Percentage of 480: 2.44%
Missing values percentage: 2.28%
这些百分比信息有助于了解贷款期限的分布情况,包括主要期限值的占比以及数据中的缺失值情况。


