Python数据分析及可视化之Pyecharts可视化1
主要是基于web浏览器进行显示,可以绘制折线图,柱状图,饼图,漏斗图,,地图,极坐标图。
首安需要在pycharm上安装相应库
一、pyecharts常用图表
1、柱状图--Bar
from pyecharts.charts import Bar
from pyecharts import  options as opts
bar = Bar()
bar.add_xaxis(['衬衣','毛衣','领带','裤子','风衣','高跟鞋','袜子'])
bar.add_yaxis('商家A',[114,55,27,101,125,27,105])
bar.set_global_opts(title_opts=opts.TitleOpts(title='某商场销售情况'))
bar.render('a.html')
输出结果:
1.2 注:使用多个add_yaxis可以绘制并列柱状图
from pyecharts.charts import Bar
from pyecharts import  options as opts
bar = Bar()
bar.add_xaxis(['衬衣','毛衣','领带','裤子','风衣','高跟鞋','袜子'])
bar.add_yaxis('商家A',[114,55,27,101,125,27,105])
bar.add_yaxis('商家B',[57,134,137,129,45,120,55])
bar.set_global_opts(title_opts=opts.TitleOpts(title='某商场销售情况',subtitle='A和B公司'))
bar.render('a.html')
输出结果:
1.3,水平直方图:bar.reversal_axis()
from pyecharts.charts import Bar
from pyecharts import  options as opts
bar = Bar()
bar.add_xaxis(['衬衣','毛衣','领带','裤子','风衣','高跟鞋','袜子'])
bar.add_yaxis('商家A',[114,55,27,101,125,27,105])
bar.add_yaxis('商家B',[57,134,137,129,45,120,55])
bar.set_global_opts(title_opts=opts.TitleOpts(title='某商场销售情况',subtitle='A和B公司'))
bar.set_series_opts(label_opts=opts.LabelOpts(position='right'))
bar.reversal_axis()
bar.render('a.html')
输出结果:
二、饼图--Pie
1、用于表现不同类别的占比情况,使用Pie方法绘制
from pyecharts import options as opts
from pyecharts.charts import Pie
l1 = ['教授','副教授','讲师','助教','其它']
num = [20,30,10,12,8]
c = Pie()
c.add('',[list(z) for z in zip(l1,num)])
c.set_global_opts(title_opts=opts.TitleOpts(title='Pie-职称类别比例 '))
c.set_series_opts(label_opts=opts.LabelOpts(formatter='{b}:{c}'))
c.render('a.html')
输出结果:
2、radius=['40%','75%'])空心图
from pyecharts import options as opts
from pyecharts.charts import Pie
l1 = ['教授','副教授','讲师','助教','其它']
num = [20,30,10,12,8]
c = Pie()
c.add('',[list(z) for z in zip(l1,num)],radius=['40%','75%'])
c.set_global_opts(title_opts=opts.TitleOpts(title='Pie-职称类别比例 '))
c.set_series_opts(label_opts=opts.LabelOpts(formatter='{b}:{c}'))
c.render('a.html')
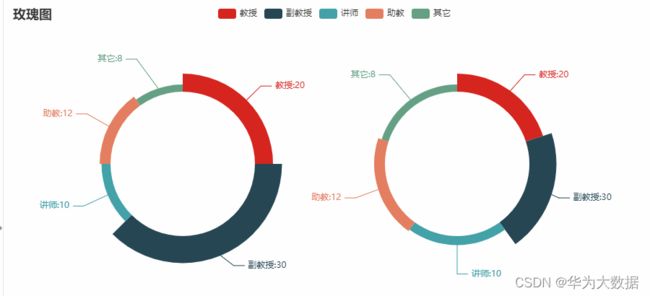
2、绘制玫瑰图
from pyecharts import options as opts
from pyecharts.charts import Pie
l1 = ['教授','副教授','讲师','助教','其它']
num = [20,30,10,12,8]
c = Pie()
c.add('',[list(z) for z in zip(l1,num)],radius=['40%','55%'],center=[240,220],rosetype='radius')
c.add('',[list(z) for z in zip(l1,num)],radius=['40%','55%'],center=[620,220],rosetype='area')
c.set_global_opts(title_opts=opts.TitleOpts(title='玫瑰图'))
c.set_series_opts(label_opts=opts.LabelOpts(formatter='{b}:{c}'))
c.render('a.html')
输出结果:
三、漏斗图--Funnel
from pyecharts.charts import Funnel
data = [45,96,39,52,68]
label = ['计算机','手机','电视机','冰箱','洗衣机']
wf = Funnel()
wf.add('电器销售量',[list(z) for z in zip(label,data)],is_selected=True)
wf.render('a.html')
输出结果:
四、散点图--Scatter
from pyecharts.charts import Scatter
from pyecharts import options as opts
week=['周一','周二','周三','周四','周五','周六','周日']
data = [81,65,48,32,68,92,87]
data2 = [34,25,88,52,29,42,67]
c = Scatter()
c.add_xaxis(week)
c.add_yaxis('商家A',data)
c.add_yaxis('商家B',data2)
c.set_global_opts(title_opts=opts.TitleOpts(title='scatter-一周的销售额(万)'))
c.render('a.html')
五、 K线图--KLine(只做了解)
from pyecharts import options as opts
from pyecharts.charts import Kline
data = [[2320.26, 2320.26, 2287.3, 2362.94],[2300, 2291.3, 2288.26, 2308.38],[2295.35, 2346.5, 2295.35, 2345.92],[2347.35, 2358.5, 2337.35, 2363.92],[2416.35, 2432.5, 2295.35, 2445.92]]
c = Kline()
c.add_xaxis(["2019/7/{}".format(i + 1) for i in range(31)])
c.add_yaxis("2019年7月份K线图", data)
c.set_global_opts(yaxis_opts=opts.AxisOpts(is_scale=True),
            xaxis_opts=opts.AxisOpts(is_scale=True),
            title_opts=opts.TitleOpts(title="Kline-基本示例"),)
c.render('a.html')
输出结果:(可以在源码里多加一些数据)
六、仪表盘--Gauge
from pyecharts import options as opts
from pyecharts.charts import Gauge
c = Gauge()
c.add("业务指标",[("完成率", 55.5)],axisline_opts=opts.AxisLineOpts(
linestyle_opts=opts.LineStyleOpts(color=[(0.3, "#67e0e3"),
 (0.7, "#37a2da"), (1, "#fd666d")], width=30)))
c.set_global_opts(title_opts=opts.TitleOpts(title="Gauge-不同颜色"),
 legend_opts=opts.LegendOpts(is_show=False))
c.render('a.html')
输出结果:
七、词云
先安装, 同上安装第三方包一样, file-setting-+---wordcloud--install
from pyecharts import options as opts
from pyecharts.charts import WordCloud
words=[('牛肉面',7800),('黄河',6181),('读者杂志',4386),('兰州大学',4222),('五台山',2550),('黄河母亲',847),('北京大学',8800)]
c = WordCloud()
c.add("",words,word_size_range=[20,80])
c.set_global_opts(title_opts=opts.TitleOpts(title='WordCloud-基本实例'))
c.render('a.html')
输出结果:
八、组合图表(Grid将Bar和Scatter图形组合在一起)
from pyecharts import options as opts
from pyecharts.charts import Bar,Grid,Line,Scatter
A=['小米','三星','华为','苹果','魅族','VIVO','OPPO']
CA=[100,125,87,90,78,98,118]
B=['草莓','芒果','葡萄','雪梨','西瓜','柠檬','车厘子']
CB=[78,95,120,102,88,108,98]
#手机柱状图显示
bar = Bar()
bar.add_xaxis(A)
bar.add_yaxis('商家A',CA)
bar.add_yaxis('商家B',CB)
bar.set_global_opts(title_opts=opts.TitleOpts(title='grid-bar'))
#水果折线图显示
line = Line()
line.add_xaxis(B)
line.add_yaxis('商家A',CA)
line.add_yaxis('商家B',CB)
line.set_global_opts(title_opts=opts.TitleOpts(title='Grid-line',pos_top='48%'),legend_opts=opts.LegendOpts(pos_top='48%'))
#网络,将上面的折线图,柱状图组合起来
grid = Grid()
grid.add(bar,grid_opts=opts.GridOpts(pos_bottom='60%'))
grid.add(line,grid_opts=opts.GridOpts(pos_top='60%'))
grid.render('a.html')
九、地图--Map
from pyecharts import options as opts
from pyecharts.charts import Map
temperature=[30,31,27,29,18]
loc = ['兰州市','天水市','白银市','武威市','甘南藏族自治州']
c =  Map()
c.add("甘肃省", [list(z) for z in zip(loc, temperature)], "甘肃",is_roam=True)
# is_roam是否开启鼠标缩放和平移漫游
c .set_global_opts(title_opts=opts.TitleOpts(title="甘肃省部分城市最高气温"))
c.render("a.html")
输出结果:
十、流动图---Geo
统计全国主要城市航班流动图(虚拟数据)
from pyecharts import options as opts
from pyecharts.charts import Geo
from pyecharts.globals import ChartType, SymbolType

c = (
        Geo()
        .add_schema(maptype="china")
        .add( "",
            [ ("哈尔滨", 77), ("重庆", 88), ("上海", 100), ("乌鲁木齐", 30),("北京", 30),("兰州",170)],
            type_=ChartType.EFFECT_SCATTER,#使用点的样式
            color="green",#绿色
        )
        .add(
            "geo",
            [("北京", "兰州"),( "兰州","北京"), ("重庆", "上海"),("哈尔滨", "重庆"),("乌鲁木齐", "哈尔滨")],
            type_=ChartType.LINES,#线的样式
            effect_opts=opts.EffectOpts(
                symbol=SymbolType.ARROW, symbol_size=6, color="blue"#小箭头的颜色
            ),
            linestyle_opts=opts.LineStyleOpts(curve=0.2),#设置两点间线缆的弯曲度
        )
        .set_series_opts(label_opts=opts.LabelOpts(is_show=False))#会把上海-广州的都显示在线缆上,这里不显示
        .set_global_opts(title_opts=opts.TitleOpts(title="主要城市航班路线和数量"))
    )
c.render('a.html')
输出结果:


