使用Echarts.js绘制环形图(指定触发高亮事件)
一、页面效果
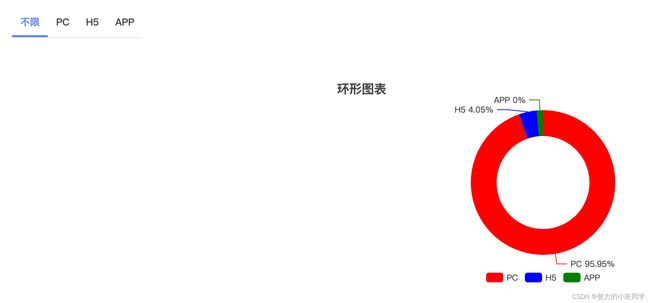
默认tab为不限,正常渲染所有数据:
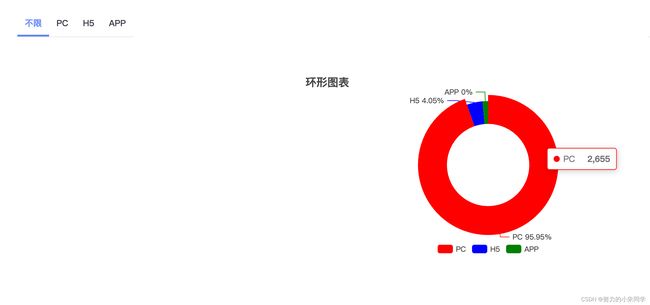
数据图形hover时,弹框展示相关信息:
切换tab时,高亮放大突出对应数据项的图形区域,并降低其他图形区域的透明度:
二、功能描述
1、tab选中不限时,环形图表中正常渲染环形图,以及对应的数据类型图例和指示文字。
2、环形图hover时,高亮hover所在的图形区域,图形区域放大,并悬浮弹窗展示相关数据。
3、在切换tab时,选中指定tab,则环形图中的对应数据图形进行高亮显示,图形区域放大,指示文字和指示线加粗处理。其余数据图形区域透明度降低处理。
4、指定图形标题和图形区域颜色。
5、设置图形最小占有区域。
*注意:
1、当前案例是在Vue2中使用,echarts.js版本为5.3.2。
三、具体代码
html结构:
<div id="pie">div>

<script>
// 引入echarts依赖
import * as echarts from "echarts";
// 声明渲染数据
info: {
	PC: 2665,
	H5: 112,
	APP: 0,
},
// 声明数据对应颜色
colors: {
	PC: "red",
	H5: "blue",
	APP: "green",
},
// 当前的渠道
channel: 0, // 0-不限 1-PC 2-H5 3-APP
// 当前渠道名称
channelName: ''
script>

<style>
#pie {
	height: 300px; /* 指定画布高度 */
}
style>
js渲染逻辑:
showData() {
      // 判断是否已经存在实例 避免重复注册
      let myChart2 = echarts.getInstanceByDom(
        document.getElementById("pie")
      );
      if (!myChart2) {
        myChart2 = echarts.init(document.getElementById("pie"));
      }
      // 定义配置项
      let option2 = {
        title: {
          text: "环形图表", // 定义图表标题
          left: "5%", // 定义图表标题的位置
        },
        tooltip: {
          trigger: "item", // 定义触发类型
        },
        legend: {
          // 底部图例说明
          bottom: 0, // 图例位置
          left: "center", // 图例位置
          data: Object.keys(this.info), // 图例信息数据
        },
        series: [
          {
            type: "pie", // 图表类型为饼图
            radius: ["45%", "70%"], // 饼图的内外半径 决定环形大小
            minAngle: 5, // 数据项占有的最小角度 用于防止数据项太少时出现数据标签重叠
            emphasis: {
              // 鼠标hover的高亮样式
              scale: true, // 是否开启高亮放大效果
              scaleSize: 10, // 放大尺寸
            },
            // 图表渲染数据项
            data: [
              {
                value: this.info.PC, // 数据值
                name: `PC`, // 数据名 与图例信息对应
                // 定义指示标签文字样式
                label: {
                  formatter: "{b} {d}%", // 文字内容 {a}:系列名 {b}:数据名 {c}:数据值 {d}:百分比。
                  color: "#333", // 字体颜色
                  fontSize: this.channel === 1 ? 14 : 12, // 根据tab选中项决定字体大小
                  fontWeight: this.channel === 1 ? "bold" : "normal", // 根据tab选中项决定字体粗细
                },
                // 定义指示标签引导线样式
                labelLine: {
                  lineStyle: {
                    width: this.channel === 1 ? 2 : 1, // 根据tab选中项决定引导线宽度
                  },
                },
                // 定义数据图形样式
                itemStyle: {
                  color: this.colors["PC"], // 决定数据图形颜色
                  opacity:
                    this.channel === 1 || this.channel === 0 ? 1 : 0.4, // 根据tab选中项决定数据图形透明度
                },
              },
              {
                value: this.info.H5,
                name: "H5",
                label: {
                  formatter: "{b} {d}%",
                  color: "#333",
                  fontSize: this.channel === 2 ? 14 : 12,
                  fontWeight: this.channel === 2 ? "bold" : "normal",
                },
                labelLine: {
                  lineStyle: {
                    width: this.channel === 2 ? 2 : 1,
                  },
                },
                itemStyle: {
                  color: this.colors["H5"],
                  opacity:
                    this.channel === 2 || this.channel === 0 ? 1 : 0.4,
                },
              },
              {
                value: this.info.APP,
                name: "APP",
                label: {
                  formatter: "{b} {d}%",
                  color: "#333",
                  fontSize: this.channel === 3 ? 14 : 12,
                  fontWeight: this.channel === 3 ? "bold" : "normal",
                },
                labelLine: {
                  lineStyle: {
                    width: this.channel === 3 ? 2 : 1,
                  },
                },
                itemStyle: {
                  color: this.colors["APP"],
                  opacity:
                    this.channel === 3 || this.channel === 0 ? 1 : 0.4,
                },
              },
            ],
          },
        ],
      };
      // 第二个参数默认为 false 即表示合并新旧option 可能会出现某类数据被删除 但对应数据折线依旧存在的问题
      // 设置为 true,表示内部所有组件都会被删除,然后根据新 option 创建所有新组件。
      option2 && myChart2.setOption(option2, true);
      // 判断选中的是不是不限
      if (this.channel !== 0) {
        // 取消之前指定的高亮图形区域
        myChart2.dispatchAction({
          type: "downplay", // 触发的事件类型 downplay-取消高亮
        });
        // 重新设置高亮图形区域
        myChart2.dispatchAction({
          type: "highlight", // 触发的事件类型 highlight-指定高亮
          // 用 name 来指定高亮数据项-与data中定义的name属性相同。
          name: this.channelName,
        });
      } else {
        // 如果选中的是不限 取消指定的高亮区域
        myChart2.dispatchAction({
          type: "downplay", // 触发的事件类型 downplay-取消高亮
        });
      }
}
js调用逻辑:
// 从接口获取图表数据res后 保存数据
this.info.PC = res.PC;
this.info.H5 = res.H5;
this.info.APP = res.APP;
// 调用渲染函数
this.showData();

// .....

// 或者切换tab后
this.channel = 1;
this.channelName = 'PC'
// 调用渲染函数
this.showData();
四、高亮事件配置项
// 如果要高亮系列:
dispatchAction({
    type: 'highlight',

    // 用 index 或 id 或 name 来指定系列。
    // 可以使用数组指定多个系列。
    seriesIndex?: number | number[],
    seriesId?: string | string[],
    seriesName?: string | string[],

    // 数据项的 index,如果不指定也可以通过 name 属性根据名称指定数据项
    dataIndex?: number | number[],
    // 可选,数据项名称,在有 dataIndex 的时候忽略
    name?: string | string[],
});

// 如果要高亮 geo 组件(从 `v5.1.0` 开始支持):
dispatchAction({
    type: 'highlight',

    // 用 index 或 id 或 name 来指定 geo 组件。
    // 可以用数组指定多个 geo 组件。
    geoIndex?: number | number[],
    geoId?: string | string[],
    geoName?: string | string[],

    // geo 组件中 region 名称。
    // 可以是一个数组指定多个名称。
    name?: string | string[],
取消高亮配置项
// 如果要取消高亮系列:
dispatchAction({
    type: 'downplay',

    // 用 index 或 id 或 name 来指定系列。
    // 可以使用数组指定多个系列。
    seriesIndex?: number | number[],
    seriesId?: string | string[],
    seriesName?: string | string[],

    // 数据项的 index,如果不指定也可以通过 name 属性根据名称指定数据项
    dataIndex?: number | number[],
    // 可选,数据项名称,在有 dataIndex 的时候忽略
    name?: string | string[],
})

// 如果要取消高亮 geo 组件(从 `v5.1.0` 开始支持):
dispatchAction({
    type: 'downplay',

    // 用 index 或 id 或 name 来指定 geo 组件。
    // 可以用数组指定多个 geo 组件。
    geoIndex?: number | number[],
    geoId?: string | string[],
    geoName?: string | string[],

    // geo 组件中 region 名称。
    // 可以是一个数组指定多个名称。
    name?: string | string[],
});
五、参考文档
Echarts文档


