RNA-seq + 下游分析:一条龙代码
这段时间太多事,生信学习耽误了很长一段时间,这几天终于撸完了生信技能树B站的RNA-seq视频。本人黑眼圈纯粹是熬夜学生信写代码所致,无任何不良嗜好,请大家放心交友。
将一台老电脑改装成了win+linux双系统,取了1万条reads进行处理顺完了这个教程:原创10000+生信教程大神给你的RNA实战视频演练。然后再完整的顺完这个教程 一个RNA-seq实战-超级简单-2小时搞定!。破电脑可怜的6G内存,处理速度奇慢!好在挂代理下载SRA文件速度还挺理想,4M/s。数据集来自一篇比较老的nature文章:
RNA-Seq 处理步骤: SRA数据下载-> SRA转fastq格式 -> 质控报告 -> 去杂噪音(去除低质量和adapter)-> 基因组比对 -> sam转bam -> bam计数
总结:fasterq-dump + fastq + multiqc + trim_galore + hisat2 + samtools
第一部分:conda linux 流程处理数据
## http://www.bio-info-trainee.com/2218.html
## https://www.ncbi.nlm.nih.gov/geo/query/acc.cgi?acc=GSE50177
conda activate rna3 # 使用python3 环境
# new stepup project: GSE50177
wkd='/home/fleame/project/'
projectName='GSE50177'
cd $wkd
mkdir $projectName && cd $projectName

mkdir sra fastq reports clean aligned

############# sra download #####
cd sra
# download the SRR_Acc_List.txt ##
# https://www.ncbi.nlm.nih.gov/Traces/study/?acc=PRJNA217298&o=acc_s%3Aa
# download the data
cat SRR_Acc_List.txt | while read id; do (prefetch ${id});done
ps -ef | grep prefetch | awk '{print $2}' | while read id; do kill ${id}; done ## kill download processes

# 下载好之后的每个sra放在单独一个文件夹,可以自行手动处理,一个个copy到sra。这里尝试用shell脚本批处理。过程:从SRR_Acc_List.txt读取,移动到sra
cat SRR_Acc_List.txt | while read id; do mv -f $id/$id.sra  ./; done
cat SRR_Acc_List.txt | while read id; do rm -rf $id; done #分两步走,检出全部移动完毕再删除文件夹

############# sra to fastq #####
for i in *sra
do
	fasterq-dump  --split-3 $i -f ../fastq
	#fastq-dump --split-3 --skip-technical --clip --gzip $i ../fastq # python2环境老是报错,切换到python3的环境OK!
done

############# fastqc multiqc #####
cd ../fastq
ls *fastq | xargs fastqc -t 2 -O ../reports
cd ../reports && multiqc ./

############# data trim and clean #####
# paired
cd ../clean
#ls ../fastq/*_1.fastq.gz >1
#ls ../fastq/*_2.fastq.gz >2
#paste 1 2 > config

bin_trim_galore=trim_galore
#cat config |while read id
#do
  #arr=(${id})
  #fq1=${arr[0]}
  #fq2=${arr[1]}
  #$bin_trim_galore -q 25 --phred33 --length 36 --stringency 3 --paired -o ./  $fq1 $fq2
#done

# single sequence
ls ../fastq/*.fastq|while read id;do ($bin_trim_galore -q 25 --phred33 --length 36 --stringency 3  -o ./  $id);done

############# align #####
# index has been build
# hisat2-build -p 4 '/home/fleame/public/references/genome/GRCh38.p13.genome.fa' genome
#ls *gz|cut -d"_" -f 1 | sort -u| while read id;
#do
  #hisat2 -p 10 -x /home/fleame/public/references/index/hisat/grch38/genome -1 ${id}_1_val_1.fq.gz   -2 ${id}_2_val_2.fq.gz  -S ../aligned/${id}.hisat.sam
#done

#unpaired
ls *fq|cut -d"." -f 1 | sort -u| while read id;
do
hisat2 -p 5 -x /home/fleame/public/references/index/hisat/grch38/genome -U ${id}.sra_trimmed.fq -S ../aligned/${id}.hisat.sam
done

############# sam to bam #####
cd ../aligned
ls *.sam| while read id ;do (samtools sort -O bam -@ 5 -o $(basename ${id} ".sam").bam ${id});done
rm *.sam
# 为bam文件建立索引
ls *.bam |xargs -i samtools index {}
# 比对结果统计
ls *.bam |while read id ;do ( samtools flagstat -@ 1 $id >  $(basename ${id} ".bam").flagstat  );done

############# featureCounts #####
gtf='/home/fleame/public/references/gtf/gencode.v32.annotation.gtf.gz'
featureCounts -T 5 -p -t exon -g gene_id  -a $gtf -o  all.id.txt  *.bam  1>counts.id.log 2>&1 &
# 这样得到的  all.id.txt  文件就是表达矩阵,这个 featureCounts有非常多的参数可以调整。

#ls *.bam |while read id;do (nohup samtools view $id | htseq-count -f sam -s no -i gene_name - $gtf 1>${id%%.*}.geneCounts 2>${id%%.*}.HTseq.log&);done
第二部分:R语言进行下游分析。
参照jimmy总结的流程,跑了一遍。
第一步:安装package
local({
  r <- getOption("repos")
  r["CRAN"] <- "https://mirrors.tuna.tsinghua.edu.cn/CRAN/"
  options(repos = r)
  Bioc <- getOption("Bioc_mirror")
  Bioc["Bioc_mirror"] <- "https://mirrors.ustc.edu.cn/bioc/"
  options(Bioc_mirror=Bioc)
})

biocPackages <- c(
  "stringi",  # handl character
  "GEOquery", # get GEO dataset
  "limma",    # differentiation analysis
  "ggfortify","ggplot2","pheatmap","ggstatsplot","VennDiagram",  # visulazation
  "clusterProfiler","Org.Hs.eg.db",  "enrichplot",                            # gene annotation
  "devtools"                                        # for github installation
)

## install packages
source("https://bioconductor.org/biocLite.R")
lapply(biocPackages,
       function(biocPackage){
         if(!require(biocPackage, character.only = T)){
           CRANpackages <- BiocManager::available()
           if(biocPackage %in% rownames(CRANpackages)){
             install.packages(biocPackage)
           }else{
             BiocManager::install(biocPackage,ask = F,update = F)
           }
         }
       }
)

# 载入R包
if (T) {
  library("FactoMineR")
  library("factoextra")
  library(GSEABase)
  library(GSVA)
  library(clusterProfiler)
  library("enrichplot")
  library(ggplot2)
  library(ggpubr)
  library(limma)
  library(org.Hs.eg.db)
  library(pheatmap)
  library(devtools)
}
第二步:数据预处理
rm(list = ls())
options(stringsAsFactors = F)

gset <- read.table(file = 'all.id.txt',header = T)
gene.datExpr <- log2(gset[,7:10]+1)
gene.datExpr$ENZEMBLID <-  str_split_fixed(gset$Geneid,"\\.",2)[,1]

gene.datExpr$median <- apply(gene.datExpr[,1:4],1,median)
gene.datExpr <- gene.datExpr[gene.datExpr$median>0,]
gene.datExpr <- gene.datExpr[order(gene.datExpr$ENZEMBLID,gene.datExpr$median,decreasing = T),]# 按照基因名、中位数大小排序
gene.datExpr=gene.datExpr[!duplicated(gene.datExpr$ENZEMBLID),]# 只保留相同symbol中中位数最大的探针

row.names(gene.datExpr) <- gene.datExpr$ENZEMBLID
gene.datExpr <- gene.datExpr[,1:4]
group_list <- c("control","control","siSUZ","siSUZ")
save(gene.datExpr,group_list,file = "ready.data.Rdata")
第三步:分析数据
###
rm(list = ls())
load(file = 'ready.data.Rdata')
getwd();
if(!dir.exists('exports')){dir.create('export')}
if(!dir.exists('data')){dir.create('data')}

## 聚类
if(T){
  library(stringr)
  data = gene.datExpr
  colnames(data) = paste(group_list, str_split_fixed(colnames(data),"\\.",3)[,1], sep = '_' )
  nodePar <- list( lab.cex = 0.3, pch = c( NA, 19 ), cex = 0.5, col = "red" )
  hc = hclust(dist(t(data)))
  pdf(file='export/hclust.pdf')
  plot(as.dendrogram(hc), nodePar = nodePar, horiz = TRUE)
  dev.off()
}

### draw PCA # slow speed
if(F){
  library("ggfortify")
  data = as.data.frame(t(gene.datExpr))
  data$group = group_list
  pdf(file='export/pca_plot.pdf')
  print(autoplot(prcomp(data[,1:(ncol(data)-1)]),data=data,colour="group",lable=T,frame=T) + theme_bw())
  dev.off()
}

if(T){
  # 画PCA图时要求是行名时样本名,列名时探针名,因此此时需要转换。格式要求data.frame
  data=as.data.frame(t(gene.datExpr))
  library("FactoMineR")# 计算PCA
  library("factoextra")# 画图展示

  dat.pca <- PCA(data, graph = F)
  # fviz_pca_ind按样本  fviz_pca_var按基因
  fviz_pca_ind(dat.pca,
               geom.ind = "point", # c("point", "text)2选1
               col.ind = group_list, # color by groups
               # palette = c("#00AFBB", "#E7B800"),# 自定义颜色
               addEllipses = T, # 加圆圈
               legend.title = "Groups"# 图例名称
  )
  ggsave('export/sample_PCA.pdf');dev.off()
}

if(T){
  ###  limma do DEG
  library("limma")
  design <- model.matrix(~0 + factor(group_list))
  colnames(design) <- levels(factor(group_list))
  rownames(design) <- colnames(gene.datExpr)
  contrast.matrix <- makeContrasts("siSUZ-control",levels=design)
  contrast.matrix
  # start the DE analysis
  fit <- lmFit(gene.datExpr,design)
  fit2 <- contrasts.fit(fit,contrast.matrix)
  fit2 <- eBayes(fit2)
  nrDEG <- topTable(fit2,coef=1,n=Inf)
  write.table(nrDEG,file = "data/nrDEG.Rdata")
  head(nrDEG)
}
只有4个样本,PCA没啥好分析的。看火山图及后续分析:
### volcano
if(T){
  library(ggplot2)
  logFC_cutoff <- with(nrDEG,mean(abs(logFC))+2*sd(abs(logFC)))
  logFC_cutoff
  #logFC_cutoff=1.5
  nrDEG$change <- as.factor(ifelse(nrDEG$P.Value<0.05 & abs(nrDEG$logFC) > logFC_cutoff,
                                   ifelse(nrDEG$logFC > logFC_cutoff,"up","down"),"not"))
  save(nrDEG,file = "data/nrDEG.Rdata")
  this_title <- paste0('Cutoff for logFC is ', round(logFC_cutoff,3),
                       "\n number of UP gene is ", nrow(nrDEG[nrDEG$change=="up",]),
                       "\n number of DOWN gene is ", nrow(nrDEG[nrDEG$change=="down",]))
  ggplot(data = nrDEG,aes(x=logFC,y=-log10(P.Value),color=change))+
    geom_point(alpha=0.4,size=1.75)+
    theme_set(theme_bw(base_size = 15))+
    xlab("log2 fold change")+ylab("-log10 p-value")+
    ggtitle(this_title)+
    theme(plot.title = element_text(size=15,hjust = 0.5))+
    scale_colour_manual(values = c("blue","black","red"))
  ggsave('export/volcano.pdf');dev.off()
}

## heatmap
if(T){
  library("pheatmap")
  annotation_col <- data.frame(SampleType=group_list)
  rownames(annotation_col) = colnames(gene.datExpr)
  #choose_gene <- c(rownames(nrDEG[order(nrDEG$logFC),])[1:2000],row.names(nrDEG[order(-nrDEG$logFC),])[1:2000])
  #choose_matrix <- gene.datExpr[choose_gene,]

  choose_matrix <- gene.datExpr[row.names(nrDEG[nrDEG$change %in% c("up","down"),]),]
  n=t(scale(t(choose_matrix)))
  #n=t(scale(t(gene.datExpr))) # all the dataset
  n[n>2]=2
  n[n< -2]= -2
  n[1:4,1:4]
  color=colorRampPalette(c("green","black","red"))(1000)
  pheatmap(n, annotation_col = annotation_col, cluster_cols = F,
           color = color,
           show_rownames = F, show_colnames = F,
           annotation_legend = T, filename = "export/heatmap_channged.pdf")  ##
}

## cluster anno
if(T){
  library(clusterProfiler)
  library(org.Hs.eg.db)
  df <- bitr(rownames(nrDEG),fromType = "ENSEMBL",toType = "SYMBOL",OrgDb = org.Hs.eg.db)
  head(df)
  nrDEG$ENSEMBL <- row.names(nrDEG)
  nrDEG <- merge(nrDEG,df, by ="ENSEMBL");
  df2 <- bitr(nrDEG$ENSEMBL,fromType = "ENSEMBL",toType = "ENTREZID",OrgDb = org.Hs.eg.db)
  head(df2)
  nrDEG <-merge(nrDEG,df2,by="ENSEMBL",all.x=T)
  head(nrDEG)
  save(nrDEG,file = "data/nrDEG.Rdata")

}

if(T){
  gene_up = nrDEG[nrDEG$change=="up",'ENTREZID']
  gene_down = nrDEG[nrDEG$change=="down",'ENTREZID']
  gene_diff=c(gene_up,gene_down)
  gene_all=as.character(nrDEG[ ,'ENTREZID'] )
  data(geneList, package="DOSE")
  head(geneList)
  boxplot(geneList)
  boxplot(nrDEG$logFC)

  geneList=nrDEG$logFC
  names(geneList)=nrDEG$ENTREZID
  geneList=sort(geneList,decreasing = T)
}

## note that the downregulated gene only 18, so the enrichment would not be signifigant.
# detailed plot
if(T){
  source('kegg_go_up_down.R')
  pro = 'siSUZ_NC'
  run_kegg(gene_up,gene_down,pro='siSUZ_NC')
  # 非常耗时,而且要。
  # run_go(gene_up,gene_down,pro='siSUZ_NC')
}

# GO in one file
if(T){
  go <- enrichGO(gene_up,
                 OrgDb = "org.Hs.eg.db",
                 ont           = "all" ,
                 pAdjustMethod = "BH",
                 pvalueCutoff  = 0.05,
                 qvalueCutoff  = 0.99,
                 readable      = TRUE)
  library(ggplot2)
  library(stringr)
  barplot(go, split="ONTOLOGY")+ facet_grid(ONTOLOGY~., scale="free")
  barplot(go, split="ONTOLOGY",font.size =10)+
    facet_grid(ONTOLOGY~., scale="free") +
    scale_x_discrete(labels=function(x) str_wrap(x, width=50))+
    ggsave('export/gene_up_GO_all_barplot.pdf')

  go <- enrichGO(gene_down,
                 OrgDb = "org.Hs.eg.db",
                 ont           = "all" ,
                 pAdjustMethod = "BH",
                 pvalueCutoff  = 0.05,
                 qvalueCutoff  = 0.99,
                 readable      = TRUE)
  barplot(go, split="ONTOLOGY",font.size =10)+
    facet_grid(ONTOLOGY~., scale="free") +
    scale_x_discrete(labels=function(x) str_wrap(x, width=50))+
    ggsave('export/gene_down_GO_all_barplot.pdf')
}
好了,我知道大家前面的代码都没看。上图!
火山图,挺好!
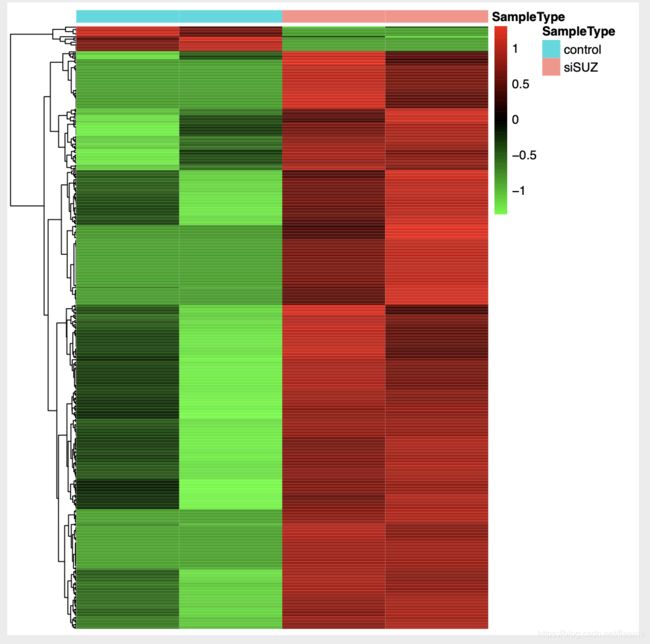
挑出变化的gene进行heatmap,挺好!
KEGG上调和下调的一起展示,挺好!
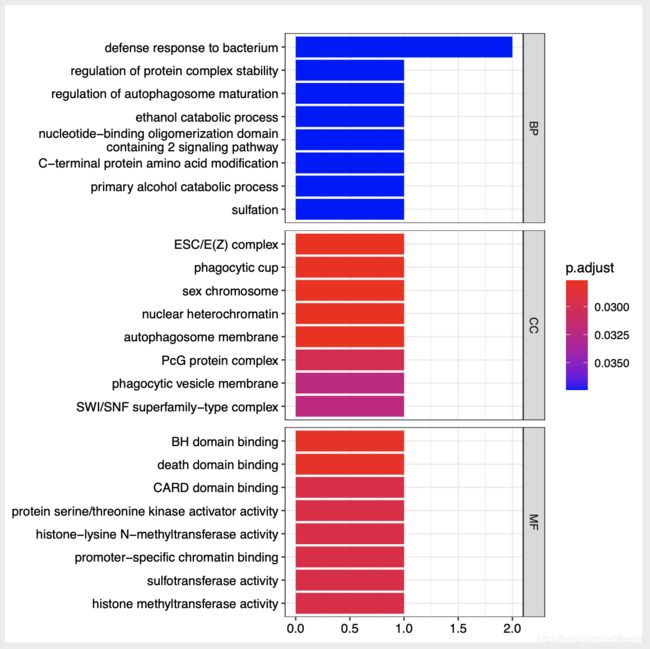
GO分析:
很奇怪,上调的基因有几百个,但是GO分析却只有5条:
下调的基因有18个,但是GO分析却却有这么多:
GSEA分析:下调通路只有18个基因,没有结果。上调的基因集可以。挺好!
至此,整个上下游分析告一段落。
一个问题
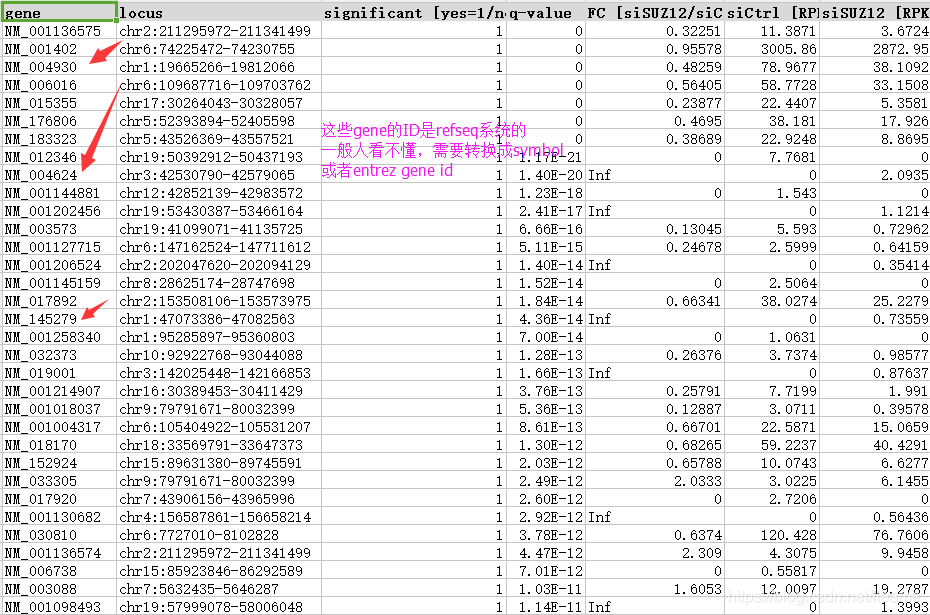
原作者提供了他们处理之后的数据,Excel展示了DEG结果。将我得到的DEG和作者的进行了比较,但是两者交叉的比较少!为什么?细致的探寻缘由之后发现:
作者用的是REFGEN的ID,这个是啥呢?代表每个mRNA,包括各个转录本。而我们得到是ENSEMBLE ID,什么对应关系?一个ENSEMBLE(gene)可以有多个转录本!我们得到多个ENSEMBLE ID时候只取一个median值最大的count进行后续分析。不知道作者怎么对转录本进行取舍, 所以两者有根本的区别。


