echarts图表联动案例
echarts是非常好用的图表插件,echarts官网:http://echarts.baidu.com/index.html
需求:展示数据比较多,放在一个图不好展示,体验不好,所以用两个图进行联动展示,X轴数据一样
我封装成了一个方法,直接传数据进去调用即可,代码:
function calltrend_view(xdata,callQuantity,successRate,failureRate,zoomSize){
	// 基于准备好的dom,初始化echarts实例
	var myChart1 = echarts.init(document.getElementById('calltrend_view1'));
	var myChart2 = echarts.init(document.getElementById('calltrend_view2'));
	// 指定图表的配置项和数据
		option1 = {
			title: {
				text: '',
				subtext: ''
			},
			tooltip: {
				trigger: 'axis',
				backgroundColor : 'rgba(255, 255, 255, 0.9)',
        		borderColor : 'rgb(222, 222, 222)',
        		borderRadius : 4,
        		borderWidth: 1,
        		textStyle : {
		            color: '#666',
		            decoration: 'none',
		            fontSize: 12
		        },
		        formatter: function (params){
		            return params[0].name + '
'
		                   + params[0].seriesName + ' : ' + params[0].value+'ms';
		        }
			},
			legend: {
				data: ["调用成功平均耗时"],
				x: '40px'
			},
			dataZoom : {
			    show : false,
			    realtime : true,
			    start : 0,
			    end : zoomSize
			},
			grid: {
		        y: 80
		    },
			xAxis: {
				type: 'category',
				data : xdata,
				splitLine : {
	                show:false
	            },
            	axisTick : {
                	show:false
               	},
				axisLabel: { //X轴刻度配置
					interval:'auto',//0:表示全部显示不间隔;auto:表示自动根据刻度个数和宽度自动设置间隔个数
					formatter: '{value}',
	                textStyle: {
	                    color: '#999999',
	                    fontSize: 12
	                }
				}
			},
			yAxis: [
		        {
		            type: 'value',
		            axisLine:{
						show:false
					},
					splitLine : {
		                show:true,
		                lineStyle: {
		                    color: '#e5e5e5',
		                    type: 'dashed',
		                    width: 1
		                }
		            },
					axisTick : {
                		show:false
                	},
                	axisLabel: {
						interval:'0',
						formatter: '{value}',
		                textStyle: {
		                    color: '#999999',
		                    fontSize: 12
		                }
					}
		        }
			],
			series: [

	        	{
	           	 	name:'调用成功平均耗时',
		            type:'line',
		            data:failureRate,
		            markPoint : {
		                data : [
		                    {type : 'max', name: '最大值'},
		                    {type : 'min', name: '最小值'}
		                ]
		            },

		            itemStyle: {
					    normal: {
					        color:'#4466ee'
					    }
					},
					barCategoryGap :'50%'
	        	}
			]
	};
	option2 = {
		tooltip: {
			trigger: 'axis',
			backgroundColor : 'rgba(255, 255, 255, 0.9)',
        	borderColor : 'rgb(222, 222, 222)',
        	borderRadius : 4,
        	borderWidth: 1,
        	textStyle : {
		        color: '#666',
		        decoration: 'none',
		        fontSize: 12
		    },
		    formatter: function (params){
		        return params[0].name + '
'
		            + params[0].seriesName + ' : ' + params[0].value+'' + '
'
		            + params[1].seriesName + ' : ' + params[1].value+'%' + '
'
		            + params[2].seriesName + ' : ' + params[2].value+'%';
		    }
		},
		legend: {
			data: ["调用量","成功率","有效率"],
			x: '40px'
		},
		dataZoom : {
		    show : true,
		    realtime : true,
		    start : 0,
		    end : zoomSize
		},
		xAxis: {
			type: 'category',
			data : xdata,
			splitLine : {
	            show:false
	        },
            axisTick : {
               	show:false
            },
			axisLabel: { //X轴刻度配置
				interval:'auto',//0:表示全部显示不间隔;auto:表示自动根据刻度个数和宽度自动设置间隔个数
				formatter: '{value}',
	            textStyle: {
	                color: '#999999',
	                fontSize: 12
	            }
			}
		},
		yAxis: [
			{
		        type:'value',
				splitLine : {
	                show:false
	            },
				axisLine:{
					show:false
				},
				axisTick : {
                	show:false
                },
                axisLabel: {
					interval:'0',
					formatter: '{value}',
		            textStyle: {
		                color: '#999999',
		                fontSize: 12
		            }
				}
		    },
		    {
		        type: 'value',
		        axisLine:{
					show:false
				},
				splitLine : {
		            show:true,
		            lineStyle: {
		                color: '#e5e5e5',
		                type: 'dashed',
		                width: 1
		            }
		        },
				axisTick : {
                	show:false
                },
                axisLabel: {
					interval:'0',
					formatter: '{value}',
		            textStyle: {
		                color: '#999999',
		                fontSize: 12
		            }
				}
		    }
		],
		series: [
			{
		        name:'调用量',
		        type:'bar',
		        data:callQuantity,
		        markPoint : {
		            data : [
		                {type : 'max', name: '最大值'},
		                {type : 'min', name: '最小值'}
		            ]
		        },

		        itemStyle: {
					normal: {
					    color:'#69a3ec',
					    barBorderRadius:[5, 5, 0, 0]
					 }
				},
				barCategoryGap :'50%'
	        },
	        {
		        name:'成功率',
		        type:'line',
		        yAxisIndex: 1,
		        data:successRate,
		        markPoint : {
		            data : [
		                {type : 'max', name: '最大值'},
		                {type : 'min', name: '最小值'}
		            ]
		        },

		        itemStyle: {
					normal: {
					    color:'#ee6276'
					}
				},
				barCategoryGap :'50%'
	        },
	        {
	           	name:'有效率',
		        type:'line',
		        yAxisIndex: 1,
		        data:failureRate,
		        markPoint : {
		            data : [
		                {type : 'max', name: '最大值'},
		                {type : 'min', name: '最小值'}
		            ]
		        },

		        itemStyle: {
					normal: {
					    color:'#9587dc'
					}
				},
				barCategoryGap :'50%'
	        }
		]
	};

	// 使用刚指定的配置项和数据显示图表。
	myChart1.setOption(option1);
	myChart2.setOption(option2);
        // 两个图表进行联动
        myChart1.connect([myChart2]);
   	myChart2.connect([myChart1]);

	setTimeout(function (){
	    window.onresize = function () {
	        myChart1.resize();
	        myChart2.resize();
	    }
	},200)
};
效果图:
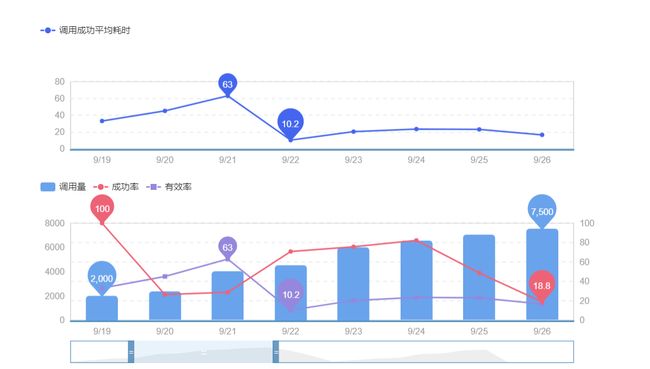
拖动dataZoom,两个表会同步联动
希望对大家有所帮助。。。