基于ELFK的可视化日志收集分析系统
1 概述
本文用来介绍如何使用开源软件Elasticsearch+Logstash+Filebeat+Kibana构建可视化的日志收集分析系统。
1.1 架构图
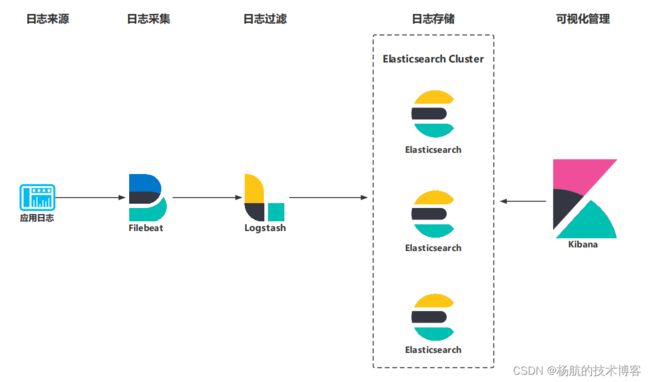
1.2 架构说明
Filebeat通过TCP端口或通过解析文件将日志信息经过Logstash转化后存储到Elasticsearch中,并通过Kibana展示查询。
2 组件说明
2.1 Elasticsearch
Elasticsearch 是一个分布式、实时的搜索与分析引擎,基于 Apache Lucene 构建而成。它可以近乎实时地存储、搜索和分析大量的数据,提供全文搜索、结构化搜索、数据分析等多种功能。Elasticsearch 采用了分布式架构,支持水平扩展,能够处理 PB 级别的数据,并且提供高可用性和容错性。
2.2 Logstash
Logstash 是一个数据收集引擎,主要用于实时传输和转换数据。它可以接收来自各种数据源的日志、事件或半结构化数据,对其进行过滤、转换和丰富,然后将其输出到 Elasticsearch、数据库或其他存储系统。Logstash 支持大量输入、过滤器和输出插件,使得数据处理管道非常灵活。
2.3 Filebeat
Filebeat 是 Elastic Stack 中的一款轻量级日志文件传输工具,替代了 Logstash 在日志收集方面的部分功能。Filebeat 直接从服务器上的日志文件读取数据,并将数据转发到 Elasticsearch 或 Logstash 进行索引和分析。相较于 Logstash,Filebeat 更加轻巧和资源友好,特别适合用于大量分布式系统的日志收集。
2.4 Kibana
Kibana 是一个开源的数据可视化平台,专门用来与 Elasticsearch 配合使用,提供对 Elasticsearch 中存储数据的可视化探索、实时分析和交互式仪表板功能。通过 Kibana,用户可以轻松创建和分享图表、地图和其他视觉化内容,以直观的方式展示 Elasticsearch 中的数据,帮助运维人员、开发人员和业务分析师快速理解并作出决策。
3 部署示例
3.1 部署规划
3.1.1 服务器规划
| 序号 | 服务器IP | 服务器配置 | 操作系统 | root密码 | 备注 |
|---|---|---|---|---|---|
| 1 | 10.10.0.48 | 8C 16GB 300GiB | centos7.9最小化安装 |
3.1.2 操作系统分区规划
请使用lvm进行分区规划。
| 序号 | 分区挂载路径 | 分区大小 | 备注 |
|---|---|---|---|
| 1 | /boot | 8c16g | |
| 2 | / | 50GiB | |
| 3 | /var | 50GiB | |
| 4 | swap | 4GiB | |
| 5 | /opt | 剩余空间 |
3.1.3 软件版本规划
| 序号 | 软件名称 | 软件版本 | 用途 |
|---|---|---|---|
| 1 | docker-compose | 1.28.1 | docker镜像单机编排工具 |
| 2 | docker | 20.10.14 | docker软件 |
| 3 | elasticsearch | elasticsearch:7.17.4 | 日志存储 |
| 4 | filebeat | docker.elastic.co/beats/filebeat:7.17.4 | 日志采集 |
| 5 | logstash | logstash:7.17.4 | 日志过滤 |
| 6 | kibana | kibana:7.17.4 | 日志可视化管理 |
3.1.4 部署路径规划
| 序号 | 用途 | 路径 | 备注 |
|---|---|---|---|
| 1 | 安装基础目录 | /opt/apps/elk | |
| 2 | elasticsearch安装目录 | /opt/apps/elk/elasticsearch | |
| 3 | filebeat安装目录 | /opt/apps/elk/filebeat | |
| 4 | logstash安装目录 | /opt/apps/elk/logstash | |
| 5 | kibana安装目录 | /opt/apps/elk/kibana |
3.1.5 服务端口规划
| 序号 | 软件名称 | 服务器端口 | 容器端口 | 备注 |
|---|---|---|---|---|
| 2 | elasticsearch | 9200 | 9200 | |
| 3 | filebeat | 9000 | 9000 | |
| 4 | logstash | 5044 | 5044 | |
| 5 | kibana | 5601 | 5601 |
3.2 部署说明
演示环境使用docker-compose进行单机编排部署。此处不介绍docker和docker-compose的安装。
3.2.1 脚本说明
- /opt/apps/elk/docker-compose.yml :编排文件
- /opt/apps/elk/.env :变量配置文件
- /opt/apps/elk/deploy.sh :部署脚本
- /opt/apps/elk/clean.sh :清除安装
#[root@localhost elk]# cat /opt/apps/elk/docker-compose.yml
version: "3"
services:
  elasticsearch:
    container_name: elasticsearch
    hostname: elasticsearch
    image: "elasticsearch:${TAG}"
    restart: always
    ports:
      - 9200:9200
    volumes:
      - ./elasticsearch/conf/elasticsearch.yml:/usr/share/elasticsearch/config/elasticsearch.yml
      - ./elasticsearch/data:/usr/share/elasticsearch/data:rw
      - ./elasticsearch/logs:/usr/share/elasticsearch/logs:rw
    environment:
      - "ES_JAVA_OPTS=-Xms512m -Xmx512m"
      - discovery.type=single-node
    networks:
      - elk_net
  kibana:
    container_name: kibana
    hostname: kibana
    image: "kibana:${TAG}"
    restart: always
    ports:
      - 5601:5601
    volumes:
      - ./kibana/conf/kibana.yml:/usr/share/kibana/config/kibana.yml
    environment:
      - elasticsearch.hosts=http://elasticsearch:9200
    depends_on:
      - elasticsearch
    networks:
      - elk_net
  filebeat:
    container_name: filebeat
    hostname: filebeat
    image: "docker.elastic.co/beats/filebeat:${TAG}"
    restart: always
    volumes:
      - ./filebeat/conf/filebeat.yml:/usr/share/filebeat/filebeat.yml
      - ./filebeat/data:/usr/share/filebeat/data:rw
    links:
      - logstash
      - elasticsearch
      - kibana
    ports:
      - 9000:9000
    depends_on:
      - elasticsearch
    networks:
      - elk_net
  logstash:
    container_name: logstash
    hostname: logstash
    image: "logstash:${TAG}"
    command: logstash -f ./conf/logstash-filebeat.conf
    restart: always
    volumes:
      # 映射到容器中
      - ./logstash/conf/logstash-filebeat.conf:/usr/share/logstash/conf/logstash-filebeat.conf
      - ./logstash/conf/logstash.yml:/usr/share/logstash/config/logstash.yml
    ports:
      - 5044:5044
    depends_on:
      - elasticsearch
    networks:
      - elk_net
networks:
  elk_net:
    driver: bridge

#[root@localhost elk]# cat /opt/apps/elk/.env
TAG=7.17.4
#[root@localhost elk]# cat deploy.sh
#!/bin/bash
chmod 777 ./elasticsearch/data
chmod 777 ./elasticsearch/logs
chmod 777 ./filebeat/data
docker-compose up -d
#[root@localhost elk]# cat clean.sh
#!/bin/bash
docker-compose down
rm -rf ./elasticsearch/data/*
rm -rf ./elasticsearch/logs/*
rm -rf ./filebeat/data/*
[root@localhost elk]#
3.2.2 执行部署
cd /opt/apps/elk
sh deploy.sh
3.3 使用示例
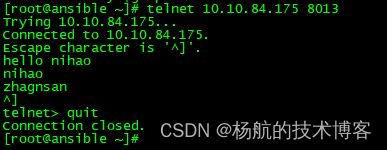
3.3.1 Filebeat
使用telnet访问filebeat的tcp端口,输入消息:hello nihao nihao zhagnsan
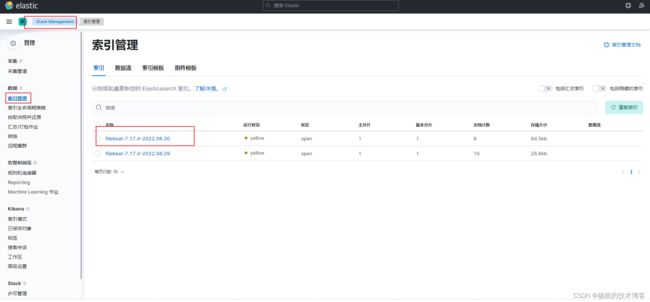
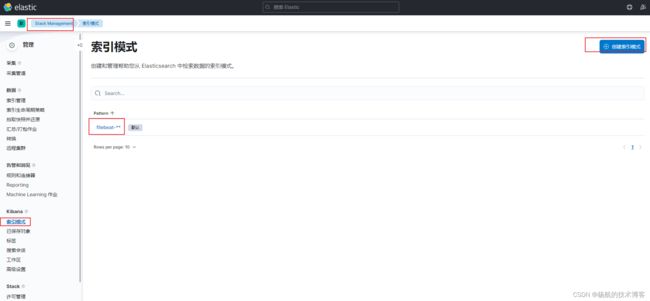
3.3.2 Kibana

4 附录
4.1 配置文件示例
#[root@localhost conf]# cat /opt/apps/elk/elasticsearch/conf/elasticsearch.yml
bootstrap.memory_lock: false
cluster.name: es-cluster
node.name: elasticsearch
node.master: true
node.data: true
network.host: 0.0.0.0
http.port: 9200
path.logs: /usr/share/elasticsearch/logs
http.cors.enabled: true
http.cors.allow-origin: "*"
xpack.security.enabled: false
#[root@localhost conf]# cat /opt/apps/elk/filebeat/conf/filebeat.yml
filebeat.inputs:
  - type: log
    enabled: true
    paths:
      # 当前目录下的所有.log文件
      - /home/project/elk/logs/*.log
    multiline.pattern: ^\[
    multiline.negate: true
    multiline.match: after
  - type: tcp
    enabled: true
    max_message_size: 10MiB
    host: "0.0.0.0:9000"
filebeat.config.modules:
  path: ${path.config}/modules.d/*.yml
  reload.enabled: false
setup.template.settings:
  index.number_of_shards: 1
setup.dashboards.enabled: false
setup.kibana:
  host: "http://kibana:5601"
output.logstash:
  hosts: ["logstash:5044"]
processors:
  - add_host_metadata: ~
  - add_cloud_metadata: ~
#[root@localhost conf]# cat /opt/apps/elk/logstash/conf/logstash-filebeat.conf
input {
    beats {
        port => "5044"
    }
}
filter {
    grok {
        match => { "message" => "%{COMBINEDAPACHELOG}"}
    }
    geoip {
        source => "clientip"
    }
}
output {
    # 选择elasticsearch
    elasticsearch {
        hosts => ["http://elasticsearch:9200"]
        index => "%{[@metadata][beat]}-%{[@metadata][version]}-%{+YYYY.MM.dd}"
    }
}
#[root@localhost conf]# cat /opt/apps/elk/logstash/conf/logstash.yml
http.host: "0.0.0.0"
xpack.monitoring.elasticsearch.hosts: [ "http://elasticsearch:9200" ]
xpack.monitoring.enabled: true
xpack.management.enabled: false
#kibana
#[root@localhost conf]# cat /opt/apps/elk/kibana/conf/kibana.yml
server.port: 5601
server.host: "0.0.0.0"
elasticsearch.hosts: ["http://elasticsearch:9200"]
i18n.locale: "zh-CN"
4.2 使用filebeat监控nginx日志
#将nginx access日志转为json格式
    log_format log_json '{ "@timestamp": "$time_local", '
    '"remote_addr": "$remote_addr", '
    '"referer": "$http_referer", '
    '"request": "$request", '
    '"status": $status, '
    '"bytes": $body_bytes_sent, '
    '"agent": "$http_user_agent", '
    '"x_forwarded": "$http_x_forwarded_for", '
    '"up_addr": "$upstream_addr",'
    '"up_host": "$upstream_http_host",'
    '"up_resp_time": "$upstream_response_time",'
    '"request_time": "$request_time"'
    ' }';
    access_log  /usr/local/nginx/logs/access.log log_json;
#filebeat
[root@localhost filebeat-7.17.4-linux-x86_64]# cat filebeat.yml
filebeat.config.modules:
  path: ${path.config}/modules.d/*.yml
  reload.enabled: true
fields:
  service_name: nginx
output.logstash:
    hosts: ["10.10.84.175:8014"]
    pretty: true
    enable: true
#执行以下命令:
# 安装Filebeat Nginx模块
./filebeat modules enable nginx

# 配置Filebeat Nginx模块
[root@localhost filebeat-7.17.4-linux-x86_64]# cat modules.d/nginx.yml
# Module: nginx
# Docs: https://www.elastic.co/guide/en/beats/filebeat/7.17/filebeat-module-nginx.html

- module: nginx
  # Access logs
  access:
    enabled: true

    # Set custom paths for the log files. If left empty,
    # Filebeat will choose the paths depending on your OS.
    var.paths: ["/usr/local/nginx/logs/access.log"]

  # Error logs
  error:
    enabled: true

    # Set custom paths for the log files. If left empty,
    # Filebeat will choose the paths depending on your OS.
    #var.paths:
    var.paths: ["/usr/local/nginx/logs/error.log"]

  # Ingress-nginx controller logs. This is disabled by default. It could be used in Kubernetes environments to parse ingress-nginx logs
  ingress_controller:
    enabled: false

    # Set custom paths for the log files. If left empty,
    # Filebeat will choose the paths depending on your OS.
    #var.paths:
# 检查配置
filebeat test config
filebeat test output
# 启动Filebeat
./filebeat -e

访问nginx的页面,使用kibana查看filebeat的日志
4.3 logstash根据自定义字段service_name自定义output
input {
    # 来源beats
    beats {
        # 端口
        port => "5044"
    }
}
# 分析、过滤插件,可以多个
filter {
    grok {
        match => { "message" => "%{COMBINEDAPACHELOG}"}
    }
    geoip {
        source => "clientip"
    }
}
output {
    # 选择elasticsearch
  if [service_name] == "nginx" {
      elasticsearch {
          hosts => ["http://elasticsearch.elk.svc.cluster.local:9200"]
          index => "nginx-%{+YYYY.MM.dd}"
      }
  } else if [service_name] == "blxx-domain-blocking" {
      elasticsearch {
          hosts => ["http://elasticsearch.elk.svc.cluster.local:9200"]
          index => "%{[@metadata][beat]}-%{[@metadata][version]}-%{+YYYY.MM.dd}"
      }
  } else {
      elasticsearch {
          hosts => ["http://elasticsearch.elk.svc.cluster.local:9200"]
          index => "%{[@metadata][beat]}-%{[@metadata][version]}-%{+YYYY.MM.dd}"
      }
  }
}
4.4 elasticsearch设置密码
配置文件使用:
xpack.security.enabled: true

1.进入es容器
docker exec -it elasticsearch bash

cd /usr/share/elasticsearch/

2.设置密码
bin/elasticsearch-setup-passwords interactive

Initiating the setup of passwords for reserved users elastic,kibana,logstash_system,beats_system.
You will be prompted to enter passwords as the process progresses.
Please confirm that you would like to continue [y/N]y
Enter password for [elastic]:
passwords must be at least [6] characters long
Try again.
Enter password for [elastic]:
Reenter password for [elastic]:
Passwords do not match.
Try again.
Enter password for [elastic]:
Reenter password for [elastic]:
Enter password for [kibana]:
Reenter password for [kibana]:
Enter password for [logstash_system]:
Reenter password for [logstash_system]:
Enter password for [beats_system]:
Reenter password for [beats_system]:
Changed password for user [kibana]
Changed password for user [logstash_system]
Changed password for user [beats_system]
Changed password for user [elastic]

3.修改密码
curl -H "Content-Type:application/json" -XPOST -u elastic 'http://127.0.0.1:9200/_xpack/security/user/elastic/_password' -d '{ "password" : "123456" }'

[root@elasticsearch elasticsearch]# curl -H "Content-Type:application/json" -XPOST -u elastic 'http://127.0.0.1:9200/_xpack/security/user/elastic/_password' -d '{ "password" : "123456" }'
Enter host password for user 'elastic':
{}
- logstash配置
[root@localhost logstash]# cat conf/logstash-filebeat.conf
input {
    # 来源beats
    beats {
        # 端口
        port => "5044"
    }
}
# 分析、过滤插件,可以多个
filter {
    grok {
        match => { "message" => "%{COMBINEDAPACHELOG}"}
    }
    geoip {
        source => "clientip"
    }
}
output {
    # 选择elasticsearch
    elasticsearch {
        hosts => ["http://elasticsearch:9200"]
        user => "elastic"
        password => "1qaz2wsx"
        index => "%{[@metadata][beat]}-%{[@metadata][version]}-%{+YYYY.MM.dd}"
    }
}
- kibana配置
[root@localhost conf]# cat kibana.yml
# 服务端口
server.port: 5601
# 服务IP
server.host: "0.0.0.0"
# ES
elasticsearch.hosts: ["http://elasticsearch:9200"]
elasticsearch.username: "elastic"
elasticsearch.password: "1qaz2wsx"
# 汉化
i18n.locale: "zh-CN"
4.5 filebeat获取k8s的nginx访问日志
filebeat.yml 容器使用root用户允许,DaemonSet部署
filebeat.inputs:
  - type: log
    symlinks: true
    enabled: true
    paths:
      - /var/log/containers/nginx-service*.log

setup.ilm.enabled: false
output.elasticsearch:
  hosts: ["http://elasticsearch-service-svc.public.svc.cluster.local:9200"]
  username: "elastic"
  password: "Abcd@123!"
  index: "nginx-%{+yyyy.MM.dd}"
setup.template.name: "nginx"
setup.template.pattern: "nginx-*"x
nginx.conf 日志设置成log_json
user  nginx;
worker_processes  2;

error_log  /var/log/nginx/error.log notice;
pid        /var/run/nginx.pid;


events {
    worker_connections  65536;
}


http {
    include       /etc/nginx/mime.types;
    default_type  application/octet-stream;

    log_format log_json '{ "@timestamp": "$time_local", '
    '"remote_addr": "$remote_addr", '
    '"referer": "$http_referer", '
    '"request": "$request", '
    '"status": $status, '
    '"bytes": $body_bytes_sent, '
    '"agent": "$http_user_agent", '
    '"x_forwarded": "$http_x_forwarded_for", '
    '"up_addr": "$upstream_addr",'
    '"up_host": "$upstream_http_host",'
    '"up_resp_time": "$upstream_response_time",'
    '"request_time": "$request_time"'
    ' }';
    access_log  /var/log/nginx/access.log  log_json;

    sendfile        on;
    #tcp_nopush     on;

    keepalive_timeout  65;

    #gzip  on;

    include /etc/nginx/conf.d/*.conf;
}