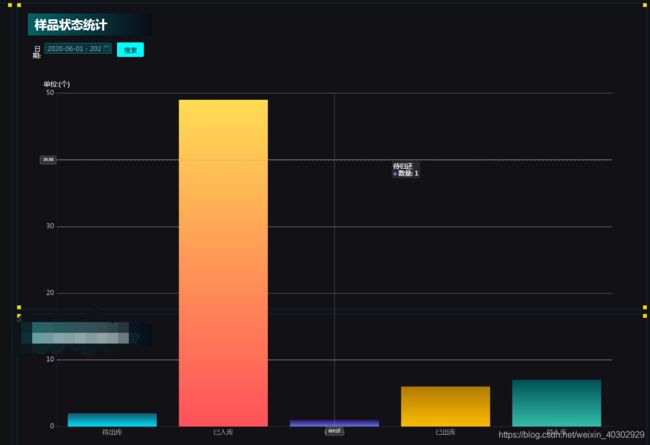
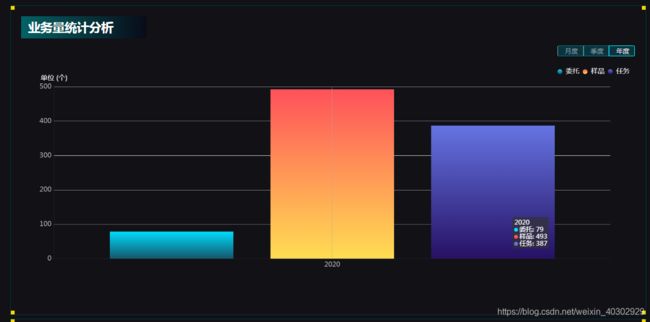
echarts柱状图颜色渐变样式

 option: {
        title: {
          text: ''
        },
        color: [
          {
            type: 'linear',
            x: 0,
            y: 0,
            x2: 0,
            y2: 1,
            colorStops: [
              { offset: 0, color: '#00DCFB' }, // 设置颜色渐变
              { offset: 1, color: '#14566B' }
            ]
          },
          {
            type: 'linear',
            x: 0,
            y: 0,
            x2: 0,
            y2: 1,
            colorStops: [
              { offset: 0, color: '#FF515A' },
              { offset: 1, color: '#FFDD53' }
            ]
          },
          {
            type: 'linear',
            x: 0,
            y: 0,
            x2: 0,
            y2: 1,
            colorStops: [
              { offset: 0, color: '#6574E2' },
              { offset: 1, color: '#261164' }
            ]
          }
        ],
        tooltip: {
          trigger: 'axis'
        },
        // 想要显示图例,要和series里name想对应
        legend: {
          data: ['委托', '样品', '任务'],
          textStyle: {
            color: '#fff',
            fontSize: 20
          },
          right: 10,
          icon: 'circle'
        },
        grid: {
          left: '3%',
          right: '4%',
          bottom: '3%',
          containLabel: true
        },
        xAxis: {
          type: 'category',
          axisTick: { show: false },
          data: [],
          axisLabel: {
            show: true,
            textStyle: {
              color: 'rgb(167,169,173)', // 更改坐标轴文字颜色
              fontSize: 20 // 更改坐标轴文字大小
            }
          }
        },
        yAxis: {
          type: 'value',
          name: '单位 (个)',
          // 坐标轴图例文字
          nameTextStyle: {
            color: '#fff',
            fontSize: 20
          },
          min: 0,
          axisLabel: {
            show: true,
            textStyle: {
              color: 'rgb(167,169,173)', // 更改坐标轴文字颜色
              fontSize: 20 // 更改坐标轴文字大小
            }
          }
        },
        series: [
          { name: '委托', type: 'bar', data: [] },
          { name: '样品', type: 'bar', data: [] },
          { name: '任务', type: 'bar', data: [] }
        ]
      }

echarts柱状图颜色渐变样式_第1张图片

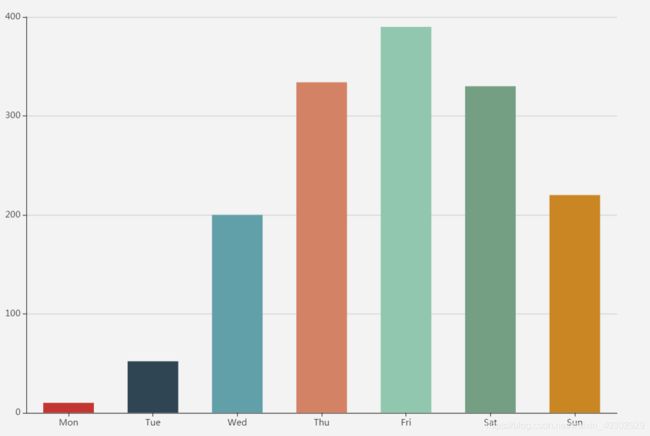
单个柱状图颜色修改

 series: [
          {
            name: '数量',
            type: 'bar',
            data: [],
            itemStyle: {
              normal: {
                // 每根柱子颜色设置
                color: function(params) {
                  const colorList = [
                    '#c23531',
                    '#2f4554',
                    '#61a0a8',
                    '#d48265',
                    '#91c7ae',
                    '#749f83',
                    '#ca8622',
                    '#bda29a',
                    '#6e7074',
                    '#546570',
                    '#c4ccd3',
                    '#4BABDE',
                    '#FFDE76',
                    '#E43C59',
                    '#37A2DA'
                  ]
                  return colorList[params.dataIndex]
                }
              }
            }
          }
        ]

 echarts柱状图颜色渐变样式_第2张图片

 单个柱状图渐变颜色修改

import echarts from 'echarts'

series: [
          {
            name: '数量',
            type: 'bar',
            data: [],
            itemStyle: {
              normal: {
                // 每根柱子颜色设置
                color: function(params) {
                  const colorList = [
                    new echarts.graphic.LinearGradient(
                      0,
                      1,
                      0,
                      0,
                      [
                        { offset: 0, color: '#00DCFB' },
                        { offset: 1, color: '#14566B' }
                      ],
                      false
                    ),
                    // 2
                    new echarts.graphic.LinearGradient(
                      0,
                      1,
                      0,
                      0,
                      [
                        { offset: 0, color: '#FF515A' },
                        { offset: 1, color: '#FFDD53' }
                      ],
                      false
                    ),
                    // 3
                    new echarts.graphic.LinearGradient(
                      0,
                      1,
                      0,
                      0,
                      [
                        { offset: 0, color: '#6574E2' },
                        { offset: 1, color: '#261164' }
                      ],
                      false
                    ),
                    // 4
                    new echarts.graphic.LinearGradient(
                      0,
                      1,
                      0,
                      0,
                      [
                        { offset: 0, color: '#FCBC00' },
                        { offset: 1, color: '#B17B00' }
                      ],
                      false
                    ),
                    // 5
                    new echarts.graphic.LinearGradient(
                      0,
                      1,
                      0,
                      0,
                      [
                        { offset: 0, color: '#33BDAB' },
                        { offset: 1, color: '#005154' }
                      ],
                      false
                    )
                  ]
                  return colorList[params.dataIndex]
                }
              }
            }
          }
        ]
echarts柱状图颜色渐变样式_第3张图片

你可能感兴趣的:(工具,echarts,vue,js)