proTb5_Animation_Percentile rank_Dimensions_RUNNING_SUM_Percentage of Total_Nested LOD_PercentileYoY
Animated presentation of monthly sales rankings
The Monthly Sales

OR
| Region/Date | 1/2016 | 2/2016 | 3/2016 | ... |
| Central | $1,540 | $1,233 | $5,828 | ... |
| East | $436 | $200 | $5,943 | ... |
| South | $9,322 | $2,029 | $32,911 | ... |
| West | $2,939 | $1,058 | $11,009 | ... |
Sort the Total Sales:
Monthly Sales Ranking
- drag the Order Date(Month - Date Value (Truncated) ) field to Pages Shelf: you will get

- drag the Sales to Label shelf
 On the Marks Card
- Quick Table Calculation : Rank
- Computing Using : Region
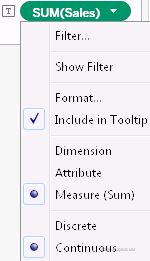
- Convert the Data Type from Continues to Discete:
 ==>
==>
- Drag the label Sum(Sales)
 from Marks Card to Rows shelf:
 - Drag the Region from Row shelf to the label shelf of the Mark Card

- Drag the Sale field from Data pane to the label shelf:
 Renderings show :
Renderings show :Using the new version of tableau and data - OR
Press Ctrl key and drap SUM(sales) to it right side:
Select SUM(Sales)(2) on the Marks card- remove Region label,
- drag Sales from data pane to label self,
- choose Grantt Bar as Mark type
Click , Alighment: left, and click the right side button of Text to edit label

- Select SUM(Sales) on the Marks card
- choose Bar as Mark type
- Press Ctrl key and drag SUM(Sales)
 to Label shelf
- Click button on the right side of Text to Edit Label

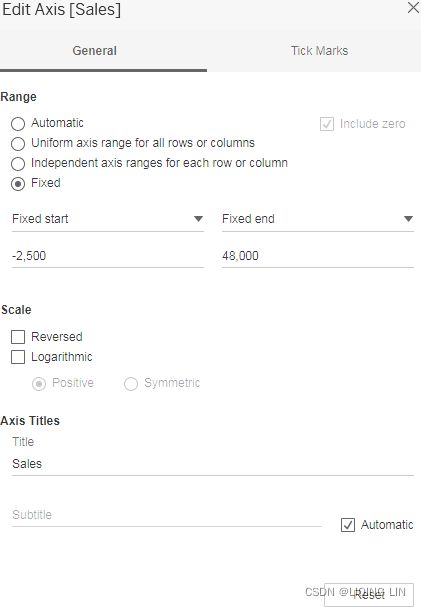
- right click Sales Axis
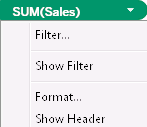
- click anyone of SUM(sales) on Column to uncheck Show Header
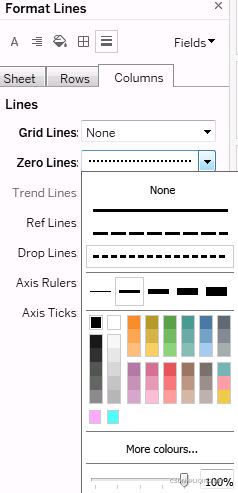
click anyone of SUM(sales) on Column to click Format... | Format Border: and
and
- right click
 on the row to uncheck Show Header
Renderings show : Renderings show :Using the new version of tableau and data
Animated Patients per Room
 https://blog.csdn.net/Linli522362242/article/details/123970001
5.1 What is a table calculation?

Figure 5-1a. Dimensions can be placed on the level of details
Measures(aggregation) and dimensions(groups)
https://blog.csdn.net/Linli522362242/article/details/122932763
The fields from the data source are visible in the data pane and are divided into Measures and Dimensions. The difference between measures and dimensions is a fundamental concept to understand when using Tableau:
- Measures are values that are aggregated. For example, they are summed, averaged, counted, or have a minimum or a maximum.
- Dimensions are values that determine the level of detail at which measures are aggregated. You can think of them as slicing the measures or creating groups into which the measures fit. The combination of dimensions used in the view define the view's basic level of detail.
Consider a Tableau view (see Fig. 5-1a). For every Tableau view, there is a virtual table determined by the dimensions used in the view. The dimensions can be on
- the rows shelf,
- columns shelf,
- pages, and
- the marks card (
- color,
- size,
- label,
- detail and
- path),
in other words, the dimensions within the level of detail.
A table calculation is a calculation / computation that is applied to all values of a single measure in a view. Table calculations are the computational workhorse of Tableau. They calculate values outside the traditional realm of “Slice by X Dimension”. Table calculations allow the user to extend their data. Table calculations are computations that are applied to all values in the entire table and are often dependent on the table structure itself. Example: Table calculations can be used to compute each month’s contribution to annual profit.
There are two easy ways to work with table calculations:
- • Use quick table calculation. Quick table calculations are a collection of commonly used table calculations (such as running total, difference, percent difference, rank, percentile, etc.).
- • Create your own table calculations from scratch using table calculation functions.
 and
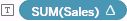
and ![]() Figure 5-1b. Table calculation applied on the measure “Sales”. Notice the triangular mark next to SUM(Sales)
Figure 5-1b. Table calculation applied on the measure “Sales”. Notice the triangular mark next to SUM(Sales)
- Computing Using Region :
- a Region can be as the direction (the Sales data of each region is distributed downward)
- and the scope (each region)
- "Percent of Total”==> sum each region/ sum all regions(down)
- Computing Using Table(down):
- Partitioning field : Table (scope)
- Addressing field : down (Direction)
- “Percent of Total”==> the tableau need to consider all calculated fields including Region field(additional partitioning: each region)==>sum each Region(down)/ sum whole Table(down)
In Figure 5-1b, dimension “Region” is placed on the rows shelf and measure “Sales” is placed on the “Label” on the marks card. The table calculation, “Percent of Total” is applied to the measure “Sales”. The table calculation is “Percent of Total”; therefore, when all the cell values are added up, it aggregates to 100%.

https://blog.csdn.net/Linli522362242/article/details/123267942
A table calculation makes use of two fields: Partitioning分区 and Addressing寻址 fields. In order to understand table calculations, it is important to understand how these fields work. They essentially define “what” a table calculation is and “how” they are performed.
- Partitioning field: this field is used to partition the data into buckets. These data buckets are then acted upon by the calculations. In other words, they define the scope or grouping of the calculation. The scope can be
- the entire table,
- a pane,
- a cell,
- a dimension
- or it can be customized even further for more advanced calculations.
- Addressing field: this field provides the direction in which we want our calculation to proceed. It defines the anchor or the source of each partition. It defines the root of the calculation.
Example: Compute the running total over a period of time (over years) partitioned by a segment. Here “segment” is the partitioning field and “date” is the addressing field.
5.2 Running Total of Sales
A running total(or cumulative sum) is a summation of a sequence of numbers that is updated every time a number is added to the sequence. It is also referred to as “partial sum”.
For example: we have a sequence of numbers “5, 2, 4, 7, 8”. To get the running total,
- start by adding 5+2 to get 7.
- To this 7 add 4 to get 11,
- to 11 add 7 to get 18,
- to 18 add 8 to get 26.
Quarterly sales by region + Cumulative quarterly sales per region
Objective: To compute the “Running Total of Sales” (compute using Table Down since the Sales data is distributed downward In the following table(Sample – Superstore.xls)).
- Data set used: “Sample – Superstore.xls”
- Expected Output: Shown in Figure 5-2. the Quarterly sales by region(Sales) and the Cumulative quarterly sales per region(Running Sum of Sales along Table(Down))

- Read in the data from “Sample – Superstore.xls” into Tableau (Shown in Fig. 5-3).

- Columns Shelf

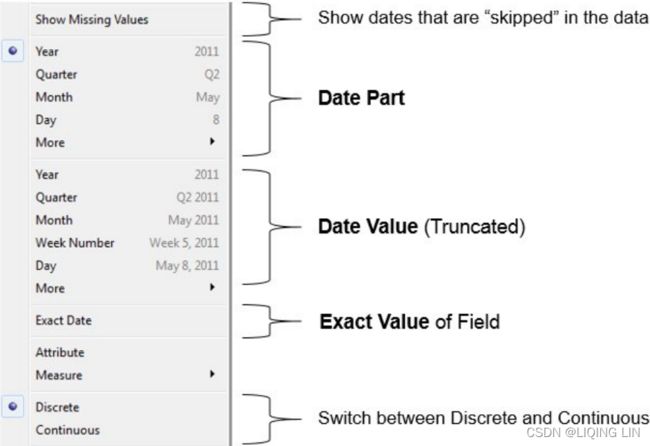
Order Date: Set it to “Discrete”. The granularity should be “Year”(in the Date Part).
Measure names:
Sum(Sales)
Sum (Sales) : Add a table calculation, “Running Total” and have it compute the running total, “Table Down”.
Rows Shelf
Region: “Discrete”
Order Date: Set it to “Discrete”. The granularity should be “Quarter”(in the Date Part). - Drag the measure “Sales” from the measures area under the data pane to “Label”
 on the marks card. The default aggregation is “Sum” (Shown in Fig. 5-7).
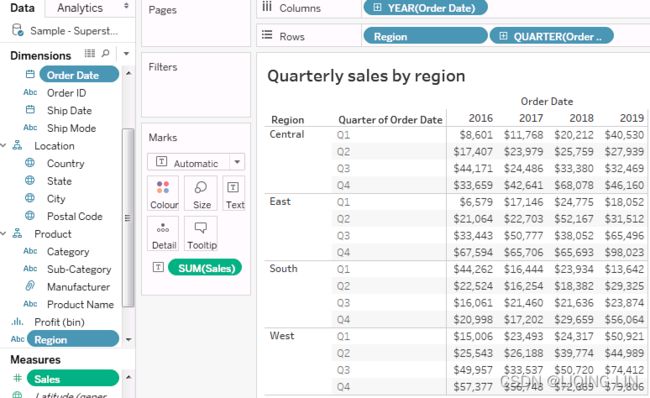
Add a quick table calculation, “Running Total”(Calculation Type) to the measure “Sum (Sales)” and compute the “Running Total” as “Table Down” (Running along Table Down). ==>
==>
Ad hoc calculations临时计算 code:Covert the Quarterly sales by region view to the Cumulative quarterly sales per region viewRUNNING_SUM(SUM([Sales])) if you want do check it by click dropdow menu click Edit Table Calculation...
- Double Click the measure “Sales” from the measures area under the data pane to drop it into the view area. The default aggregation is “Sum”
 this view is about the Cumulative quarterly sales per region(Running Sum of Sales along Table(Down)) and the Quarterly sales by region(Sales)
Notice that “Measure Names” appears on the columns shelf and Filter shelf. Also, “Measure Values” appears on Label on the marks card. - Drag “Measure Names” and pull it to the right of “Year (Order Date)” on the columns shelf (Shown in Figure 5-11. Dimension “Measure Names” placed to the right of “Order Date” on the columns shelf).
 Notice the change in display.
 - Drag the above, then can be seen from the display, first the measure “Sales” is aggregated and then its “Running Total” is displayed.

for example: for “2016” and for “Central Region”.
The Sales made in Q1 of 2016 is 8,601.
To this we add the sales of Q2, i.e. 17,407 to give the running sum as 26,008.
To this running sum of 26, 008, we add the Q3 sales of 44,171 to give the new running sum of 70,179.
To this we add the Sales for Q4, i.e. 33,659 to give the running sum of 103, 838.
Note that the running sum of “Sales” is computed “Table Down”. - Let us add Subtotals to the view. For this, select “Analysis” from the menu bar, then click on “Totals” and select “Add All Subtotals”
(Analysis ➤ Totals ➤ Add All Subtotals)(Shown in Figure 5-13. Apply “Add All Subtotals” to measures in the view).
The final output (Shown in Fig. 5-14):
Note the selected cell is about the total sales in 2016 including all regions and all quarters
5.3 Profitability as Percent of Total
Percent of total is also called as percent distribution. It is computed using the formula that divides an amount by the total.
Example: To find the percent of total for each of the following numbers: 100, 400 and 600,
- first determine the total by adding up the numbers 100, 400 and 600. The total is (100+400+600) = 1100.
- Then find what percent of total, 1100 is the number 100. This can be computed as (100 / 1100) *100 = 9.090%.
Profit and Loss as a Percentage of Total sales for categories of products per segment per region across several years
Objective: To demonstrate “Profit and Loss as a Percent of Total” for categories of products per segment per region across several years (2016, 2017, 2018 and 2019).
- Data set used: Sample – Superstore.xls
- Expected output: (Shown in Figure 5-15. “Profit and Loss as a Percent of Total” sales for categories of products per segment per region across several years.

- Read in the data from “Sample – Superstore.xls” (Shown in Fig. 5-16).
- columns shelf

Order Date (“Discrete” with the granularity set to “Year”). The visual cue (“Order Date” appears blue in color on the columns shelf) indicates that the dimension is discrete. By default, date type fields have a hierarchy defined on it and the default is the highest level in the hierarchy, which in this case is “Year”.
Sales – Aggregation set to “SUM”
Add a Table Calculation, “Percent of Total” to the measure “Sales” and summarize the
values from – “Cell”
Rows Shelf
Region, Segment and Category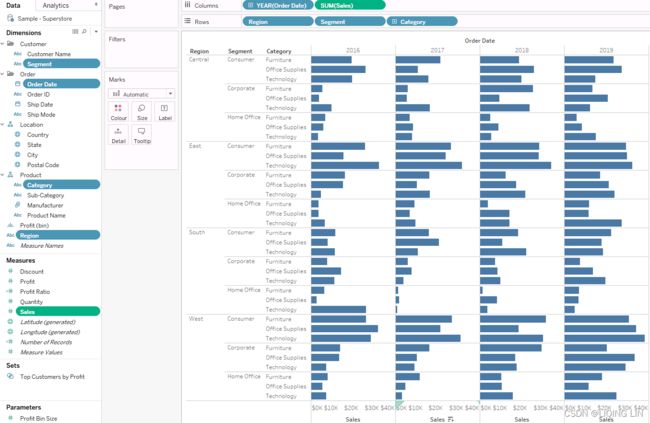
- Add a table calculation, “Percent of Total”.
 ==>
==> Figure 5-24. Output after applying the “Table Calculation - Percent of Total” to the measure “Sales” Note: the value of each cell ( total sales for its category of products of segment of region in each year) is 100% for itself
- Create a calculated field, “Profit or Loss”, as shown in Fig. 5-25.
IF [Profit] > 0
   THEN "Profit"
ELSE
   "Loss"
END
Drag the newly created dimension “Profit or Loss” and drop it on “Color” on the marks card (Shown in Fig. 5-26).
-
Press control key (CTRL) and drag the measure “Sum (Sales) (where we have added the table calculation)”
 from the columns shelf and drop it on the “Label” on the marks card (Shown in Fig. 5-27).
5.4 Moving average
It is called by various names, such as rolling average, running average, rolling means, or running means.
##################### rolling window ########################
##################### rolling window ########################
5.4.1 Where is it used?
- • In the technical analysis of financial data, such as stock prices, returns etc.
- • To determine the market conditions. It is used with time-series data to iron out消除 short-term price fluctuations or noises and highlight longer-term trends.
- • To identify trends[trendz] and reversals逆转. Moving averages are lagging indicators. They are never used to predict new trends but confirm trends once they have been established.
Example: a stock is termed uptrend when its price is above the moving average and the average slopes upwards. Likewise a stock is considered downtrend when its price is below the moving average and the average is sloping downward. - • To measure the strength of an asset’s momentum. This has to do with the time period chosen for computing the moving average.
- • Short-term momentum: <=20 days
- • Medium-term momentum: between 20 to 100 days
- • Long-term momentum: > 100 days
- • A valuable tool in planning trading strategy.
- • To help with creation of a number of other technical indicators such as
- moving average convergence divergence (MACD)
 https://blog.csdn.net/Linli522362242/article/details/121406833
 - or Bollinger’s bands
 .
.
 : Standard deviation factor of our choice
- To compute the standard deviation,
first we compute the variance:
Then, the standard deviation is simply the square root of the variance:
-
• To help with stochastic measurements.
- moving average convergence divergence (MACD)
5.4.2 Types of moving average
Moving averages are lagging indicators. they are based on events that have already occurred in the market.
they are not predictive indicators.
- Simple Moving Average: This is computed by taking arithmetic mean of a given set of values. The simple moving average, as you may have guessed from its name, is computed by adding up the price of an instrument over a certain period of time divided by the number of time periods. It is basically the price average over a certain time period, with equal weight being used for each price. The time period over which it is averaged is often referred to as the lookback period or history. Let's have a look at the following formula of the simple moving average:https://blog.csdn.net/Linli522362242/article/details/121406833

 : Price at time period i
 : Number of prices added together or the number of time periods
- Weighted Moving Average: This is used to ensure that the most recent values have the most impact on the average. It uses values that are linearly weighted.
Example: the oldest value is given a weight of 1, the next oldest value a weight of 2, and so on … all the way up to the most recent value which gets the highest weight. - Exponential Moving Average: This is similar to the simple moving average. The difference lies in the fact that while a simple moving average will remove the older values as the new values become available, the exponential moving average calculates the average of all historical ranges, starting at the points that one specifies.
 OR
OR 

5.4.3 Demo 1
- P : Current price of the instrument,
 : Initial price of the instrument
  : EMA value prior to the current price observation
 : Smoothing constant, most commonly set to
a weight factor, applied to new price observations and a weight factor applied to the current value of EMA to get the new value of EMA.
- n : Number of time periods (similar to what we used in the simple moving average)
- ewm or ewma(Exponential Weighted Moving Average)https://pandas.pydata.org/docs/reference/api/pandas.DataFrame.ewm.htmlDataFrame.ewm(com=None, span=None, halflife=None, alpha=None, min_periods=0, adjust=True, ignore_na=False, axis=0, times=None, method='single')pandas.DataFrame.ewm — pandas 1.4.2 documentation
- adjust bool, default True
Divide by decaying adjustment factor除以衰减调整因子 in beginning periods to account for imbalance in relative weightings (viewing EWMA as a moving average).-
When
adjust=True(default), the EW function is calculated using weights .
.
For example, the EW moving average of the series [x0,x1,...,xt] (or a price list) of the instrument would be:
等式的上方是对当前价格到最初价格的加权求和,用的加权因子是
等式的下方是对所有加权因子的求和(可用等比例求和公式)
等比例求和公式推导
 and
and (公比
(公比 )
)
 ==>
==>
-
When
adjust=False, the exponentially weighted function is calculated recursively: OR
OR
-
- adjust bool, default True
- P : Current price of the instrument,
5.4.3 Moving Average of Monthly Sales
Objective: To demonstrate the “Moving Average” of the measure “Sales” across several years (2016, 2017, 2018 and 2019)
- Input Data Set: “Sample - Superstore.xls”
- Expected output: Shown in Fig. 5-28.

- Columns shelf :

Month(Order Date) : Continuous Date Value(truncated)
- Rows shelf :

- Sum(Sales)
 with calculation type – “Moving Calculation”, summarize values using “Average”
OR Quick Table Calculation | “Moving Average” and Compute Using | Table(across)Exclude Current Value: (14,236.90 + 4,519.89 + 55,691.01 + 28,295.35)/4 = 25685.8 or 25686// WINDOW_SUM(expression, [start, end]) // -4, -1, the index of current value = 0 WINDOW_AVG(SUM([Sales]), -4, -1)
Include Current Value: (14,236.90 + 4,519.89 + 55,691.01 + 28,295.35+23,648.29)/5 = 25278.28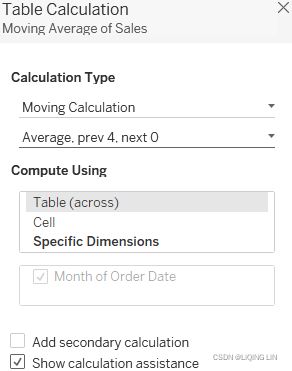
 (Exclude Current Value)
 Click on “4 nulls”
 ==>
==>

- Sum(Sales)
 Synchronize Axis
- unhide NULL:
 uncheck Show, then right click “4 nulls” ==> Hide Indicator
- Sum(Sales)
5.5 Rank
Tableau ignores “nulls” in rank calculations. They appear as blank rows.
The following choices are available on the type of ranking that one can apply:
5.5.1 Demo 1
Objective: To rank the “Sub-Category” based on the “Sales Amount”. The sub-Category with the highest sales amount is ranked one followed by the Sub-Category with the next highest sales amount, which is ranked two and so on…
- Input data Set: “Sample – Superstore.xls”
- Expected Output: Shown in Fig. 5-42.

- Columns shelf
- Sum(Sales)
- Row shelf
- Sub-Category

- Sub-Category
- Table calculation
- Rank

RANK(SUM([Sales])) - Running Along: Table (Down)
- Sort Order: Descending
- Rank duplicate Values as: Competition (1,2,2,4)


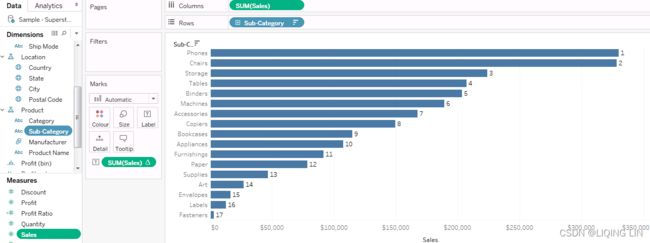
 convert the Sum (Sales) on the “Label” on the marks card to “Discrete”
- Now drag the Sum (Sales)
 which is placed on the “Label” on the marks card and place it to the left of “Sub-Category”
- Next, let us add a “Category” to be the leftmost column on the rows shelf (Shown in Fig. 5-53).

 ==>
==>
“Running Along” for rank of sales changed to pane (Down)
Here each category is a panel
- Rank
5.6 LOD (Level of Detail)
Level of detail (LOD) is a very important concept. An understanding of the idea of details helps with understanding the level of detail. Let us look at the areas where one can add details to the view / worksheet.
- • Columns shelf
- • Rows shelf
- • Detail on the marks card
Details are defined by the dimensions that are used to segment the measures.
Example:
- Drag the dimension “Region” from the dimensions area under the data pane and place it on the rows shelf.
- Drag the measure “Sales” from the measures area under the data pane and place it on the columns shelf (Shown in Fig. 5-58).
The measure “Sales” (default aggregation is SUM) is aggregated by(is broken down by) dimension “Region”.
- Let us add another dimension “Category” to the rows shelf (Shown in Fig. 5-59).
 By placing the dimension “Category” on the rows shelf, we have added more granularity and less aggregation to the view / worksheet. It implies that we are adding to our level of detail.
Example:
- Drag the measure “Sales” from the measures area under the data pane and place it on the columns shelf.
- Drag the measure “Profit” from the measures area under the data pane and place it on the rows shelf.
 The output is a scatter plot with a single mark on the view. The reason behind the single mark is that the measure is not yet segmented as per any dimension.
 - Drag the dimension “Customer Name” from the dimensions area under the data pane and place it on “Details” on the marks card
 The output shows the measure being segmented by “Customer Name”. The view displays mark for every single customer. It makes the view more granular and less aggregated.
Yet another way to add details to the view is by using LOD (Level of Details). LOD expression represents an elegant and powerful way to answer questions involving multiple levels of granularity in a single visualization. Level of detail expressions provide a way to easily compute aggregations that are not at the level of detail of the visualization. You can then integrate those values within visualizations in arbitrary ways. From Tableau v9 onwards, a new concept called level of detail (LOD) expressions has been introduced. LOD expressions can be used to represent the data in different ways at different levels.
There are three options available with LOD. They are:
- • Include
- • Exclude
- • Fixed
Exclude
The exclude LOD calculation returns results relative to your visualization; this implies that it does matter what dimensions are used in the view这意味着视图中使用的维度很重要
Input: “Sample – Superstore.xls”
Expected Output: 
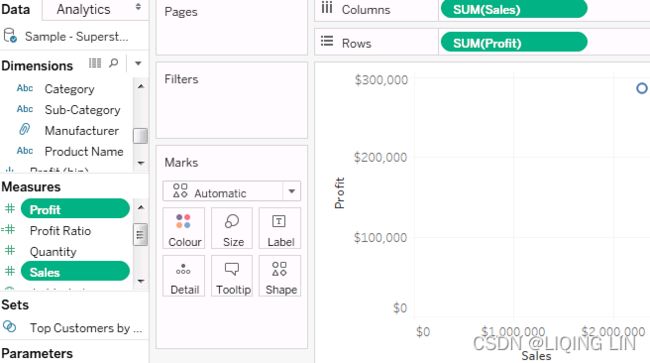
The view / worksheet should display the sales by region, by state and by city alongside the dimensions, “Region”, “State” and “City”.
The detail level of the current view is Region/State/City
- Create two calculated fields, “Exclude_Region_Sales” and “Exclude_State_Sales”.
- Region_Sales: To get the sales by region, we will exclude the “State” and “City” dimensions
{EXCLUDE [State], [City] : SUM([Sales]) }
-
State_Sales: To get the sales by state, we will exclude the “City” dimension
{EXCLUDE [City] : SUM([Sales]) }
-
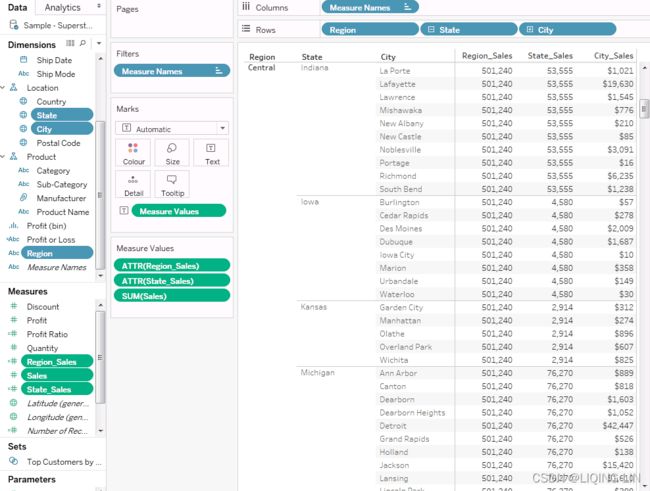
Drag the measure “Region_Sales” from the measures area under the data pane and drop it into the view/worksheet
The detail level of the view (Region/State/City) ==> exclude State, City ==> Region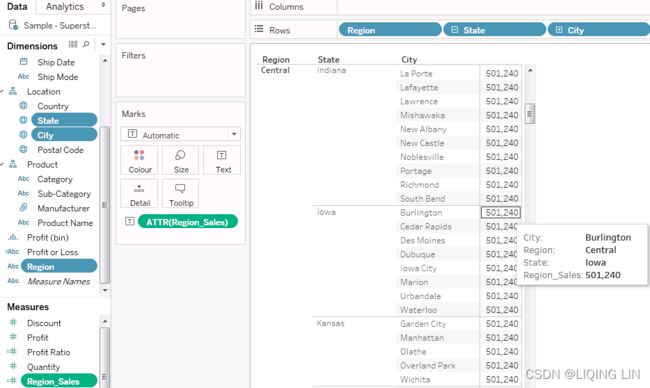
-
Drag the measure “State_Sales” from the measures area under the data pane and drop it into the view/worksheet
The detail level of the view (Region/State/City) ==> exclude State ==> Region/State
-
Double click the measure “Region_Sales” from the measures area under the data pane
Double click measure “State_Sales” from the measures area under the data pane
Double click measure "Sales" from the measures area under the data pane, Note : The detail level of the view (Region/State/City), in other words, here return the total Sales on each city,
Then, click the column of Sales in the view to select Edit Alias... ==> enter City_Sales
 In the State Iowa, 57.4+278.4+2,008.8+1,687.3+10.0+358.4+149.1+30.3 = 4580(4579.7)
- Region_Sales: To get the sales by region, we will exclude the “State” and “City” dimensions
Fixed
Fixed LOD calculations are not relative to the view. They focus only on the dimension that we use in the “Fixed LOD Calculations”, regardless of what is or what is not included in the view.
- Input: “Sample – Superstore.xls”
- Expected Output:
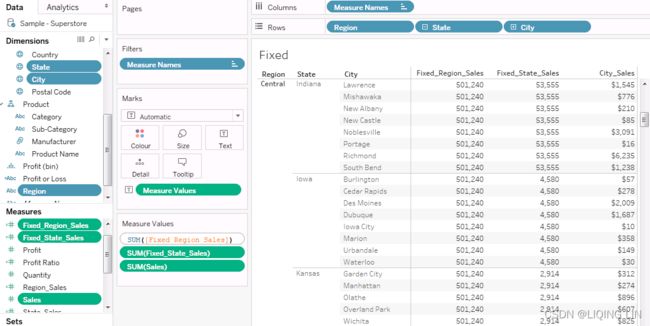
- Drag the dimension Region, State, City from the dimensions area under the data pane to the rows shelf
- use LOD - fixed : without any consideration to the dimensions present in the view.
Create two calculated fields, “Fixed_Region_Sales” and “Fixed_State_Sales”- Fixed_Region_Sales
{Fixed [Region] : SUM([Sales])}
- Fixed_State_Sales
{FIXED [State] : SUM([Sales]) }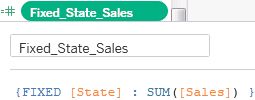
-
Double Click the measure “Fixed_Region_Sales” in the measures area under the data pane
Double Click the measure “Fixed_State_Sales” in the measures area under the data pane
Double Click the measure “Sales” in the measures area under the data pane; Note : The detail level of the view (Region/State/City), in other words, here return the total Sales on each city,
- Fixed_Region_Sales
Include
Input: “LOD.xls”
 ==>
==>
 Note: current level of detail: Amount per transaction per customer
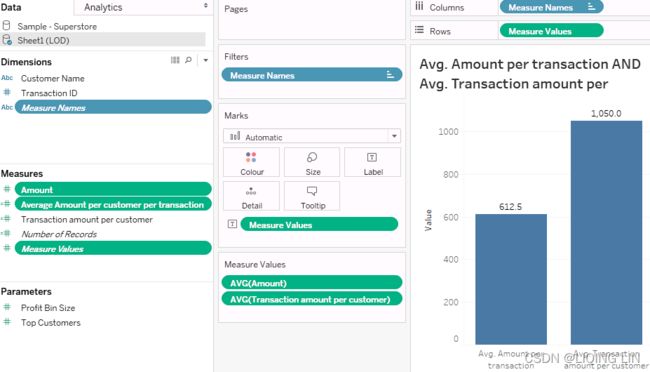
We would like to view the “Average Amount per transaction”. Alongside this, we would like to view the “Average Transaction Amount per Customer”.
Expected 2 Outputs: 
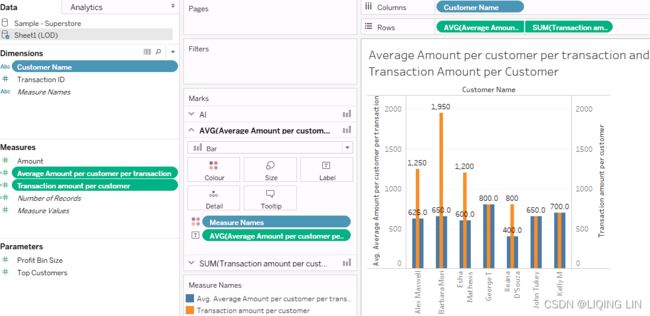
- To get the “Average Amount per transaction”, simply sum up the transaction amounts of all customers and then divide by the number of transactions
 7350/12=612.5
Note: current level of detail: Amount per transaction per customer
so we don't need to create an additional calculated field, just use a aggregation (AVG([Amount])) - To get the “Average Amount per customer per transaction”,
- aggregate the transaction amount for each customer
- and aggregate the number of transactions for each customer.
- Finally the transaction amount per customer divide by their respective number of transactions
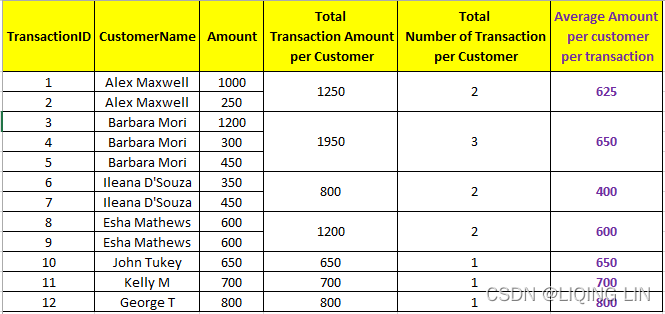
- To get the “Average Transaction Amount per Customer”, aggregate the transaction amount for each customer, and then sum up the aggregated amount for all customers(existing aggregate times). Finally divide the aggregated amount for all customers by aggregate times

Some people will ask why not just find the total transaction amount and divide by the number of unique customers, but the problem is the tableau doesn't know how many customers there are.(Unless you use sql and other statements) - Create a calculated field, Transaction amount per customer
//aggregate the transaction amount for each customer //by using "Include" LOD {INCLUDE [Customer Name] : SUM([Amount]) } Note: current level of detail: Amount per transaction per customer
 - Drag the dimension “Measure Names” from the dimensions area under the data pane to the columns shelf.
- Drag the dimension “Measure Names” from the dimensions area under the data pane to Filters Shelf
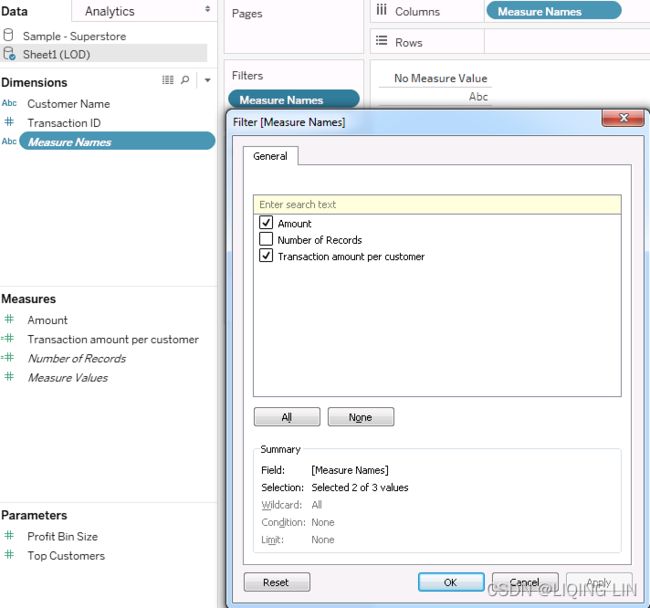
- Drag the measure “Measure Values” from the measures area under the data pane to the rows shelf

- Change the aggregation of both the measures(here is SUM), “Amount” and “Transaction amount per customer” to “Average”, you can check the change of the Filters
 check
check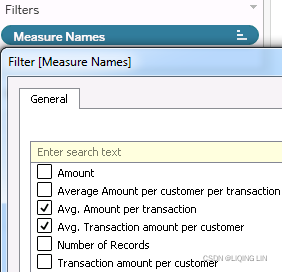

-
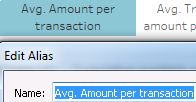
give the Avg.Amount in the view an Alias Avg. Amount per transaction
 ==>
==>
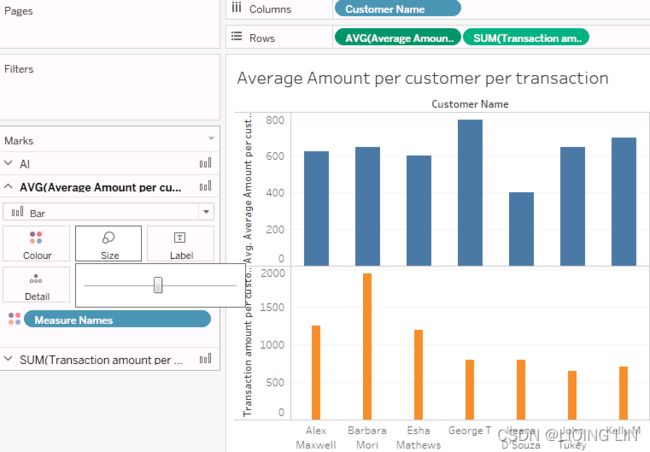
- Create a calculated field, Average Amount per customer per transaction
// OR INCLUDE [Transaction ID]: AVG( { FIXED [Transaction ID]: AVG( { INCLUDE [Customer Name]: SUM([Amount]) } ) } Nested LOD expressions
- Inner include statement : aggregate(sum) the transaction amount for each customer(along the direction of [Customer Name])
- Outer Fixed(or Include) : Average the results of the inner layer by the number of transactions(along the direction of [Transaction ID])
-
OR
// OR INCLUDE [Transaction ID]: AVG( { FIXED [Transaction ID]: AVG( [Transaction amount per customer]//{ INCLUDE [Customer Name]: SUM([Amount]) } ) }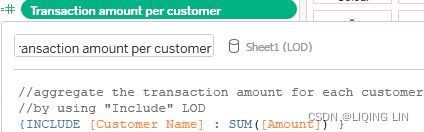 ==>
==>
 ==>
==> AND
AND ==>
==> Never Show to remove duplicate Mark Label
Just to cross-verify the “Average Transaction Amount per Customer”, let us perform the below steps:
- Drag the dimension “Customer Name” from the dimensions area under the data pane and place it on the rows shelf
- Drag the measure “Amount” from the measures area under the data pane and place it on the “Label” on the marks card
- Select “Analysis” on the menu bar. Select “Totals” and then select “Show Column Grand Totals”.
Analysis ➤ Totals ➤ Show Column Grand Totals.

Total transction amount per Customer
Note: original data level of detail: Amount per transaction per customer ==>use Customer Name to aggregate it ==>Total transction amount per Customer - Use “Average” aggregation for grand total
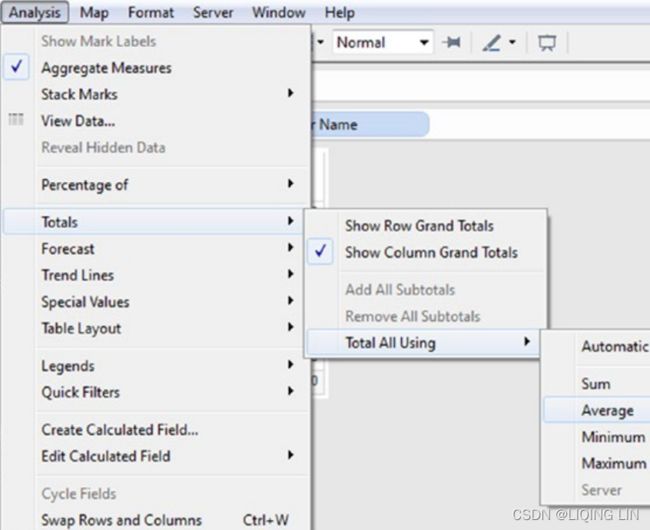

The output after the aggregation for grand total was changed to “Average”
Total transction amount per Customer==>[Customer Name]==>Average Transaction Amount per Customer
This can be achieved in another two ways:
- Average Transaction Amount per Customer
AVG( {Fixed [Customer Name] : Sum(Amount)}) using AGG to call AVG ==>[Customer Name] including SUM then AVG aggregation ==>Average Transaction Amount per Customer
 - WINDOW_AVG(Sum(Amount))
WINDOW_AVG(Sum(Amount))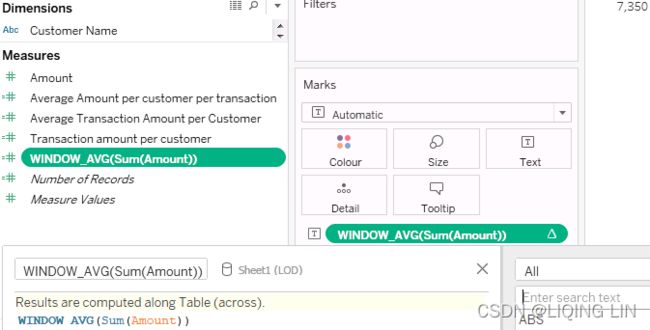 Sum(Amount) ==> Total Transcation ==>WINDOW_AVG ==>Total Transcation
But if we give the view a dimension (Customer Name) ==>Transaction Amount per Customer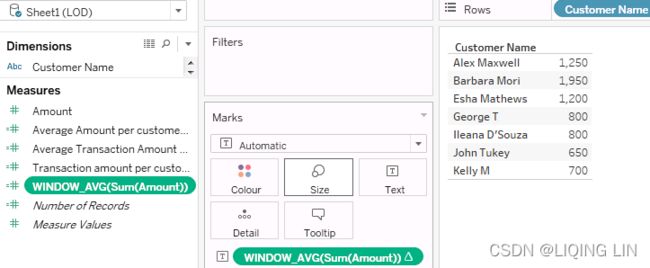
- Transaction amount per customer
//aggregate the transaction amount for each customer //by using "Include" LOD {INCLUDE [Customer Name] : SUM([Amount]) } We need to give it an aggregation function(here is AVG) ==>[Customer Name] including SUM then AVG aggregation==>Average Transaction Amount per Customer
 - Average Amount per customer per transaction
// OR INCLUDE [Transaction ID]: AVG(
{ FIXED [Transaction ID]: AVG( // OR SUM(
    [Transaction amount per customer]//{ INCLUDE [Customer Name]: SUM([Amount]) }
  )
}
- get the result of Transaction amount per customer
or excute { INCLUDE [Customer Name]: SUM([Amount]) } - then excute FIXED [Transaction ID]: AVG(Transaction amount per customer) ==>Average Transaction Amount per customer per transaction !=(the original level of detail: Amount per transaction per customer)
- we give aggregation(default SUM) to the LOD expression,==>[Transaction ID] ==> Total Transaction
- get the result of Transaction amount per customer
Another case: Average Amount per customer per transaction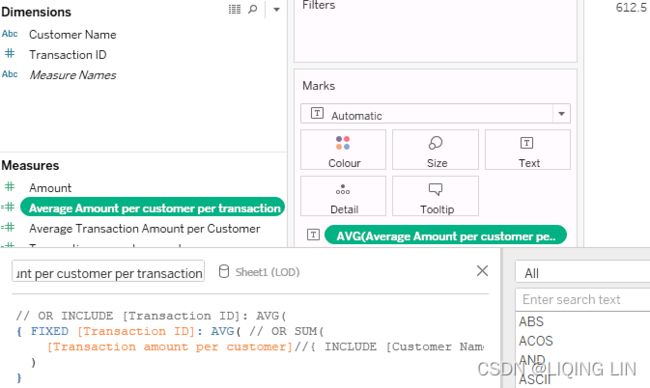
- get the result of Transaction amount per customer
or excute { INCLUDE [Customer Name]: SUM([Amount]) } - then then excute FIXED [Transaction ID]: AVG(Transaction amount per customer) ==>Transaction Amount per customer per transaction ==(the original level of detail: Amount per transaction per customer)
- we give aggregation(AVG) to the LOD expression, ==>[Transaction ID] ==> Average Amount per transaction
5.7 Percentile
Percentiles divide the data set into 100 equal parts. Percentiles measure position from the bottom. They are used to determine the relative standing of an individual in a population. In other words, they provide the rank position of an individual. Where have we seen percentiles being used? It is usually used with test scores and graduation standings毕业排名. Graduation standings refers to the individual’s standing at graduation relative to other graduate students.
- Definition: Percentile is a measure used to determine the percentage of total frequency scored below that measure. Percentile rank is percentage of scores that fall below a given score.https://blog.csdn.net/Linli522362242/article/details/91037961
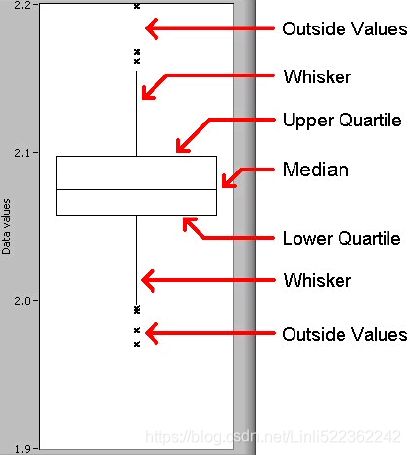
- The box represents quartiles of the data方框代表数据的四分位数,
The median(the center line denotes the median value) is the 50th percentile, as the number of data points below the median is about 50 percent of the data.- Decile: This is 10th percentile, which means the number of data points below the decile is 10 percent of the whole data.
- Quartile: This is one-fourth of the data, and also is the 25th percentile. The first quartile(Q1) is 25 percent of the data, the second quartile(Q2) is 50 percent of the data, the third quartile(Q3) is 75 percent of the data. The second quartile is also known as the median or 50th percentile or 5th decile.
- Interquartile range( IQR = Q3-Q1 ): This is the difference between the third quartile(Q3, upper quartile) and first quartile(Q1, lower quartile). It is effective in identifying outliers in data. The interquartile range describes the middle 50 percent of the data points.
- the whiskers represent the full range of the data
- Upper Quartile (上边缘, Q3) : The maximum value in the data box other than the abnormal point
- Lower Quartile (下边缘, Q1) : The minimum value in the data box other than the abnormal point
- Outliers (the abnormal point,
 ):
): 
- n=40 numbers: 53 53 61 61 63 65 67 67 69 69, 69 70 70 71 74 75 75 76 77 78, 79 80 81 81 81 81 82 84 85 86, 87 87 87 88 89 90 91 91 94 95
Q1=(69+69)/2=69;Q3=(86+87)/2=86.5, since n is even.
IQR = Q3-Q1=86.5-69=17.5;
lower fence: Q1-1.5IQR=42.75;
upper fence: Q3 + 1.5IQR=112.75;So there are no outliers。
upper marginal : 95,
lower marginal: 52
- The box represents quartiles of the data方框代表数据的四分位数,
- Formula: To determine the percentile rank of a score, x, out of a total of n scores在总共 n 个分数中, the formula is Percentile Rank = ((Number of scores below x) / n) * 100
- Example: In a class of 200 students, Mason scored 25th rank. His percentile standing in the class is: ( (200-25) / 200 )=(175 / 200) * 100 = 87.5%
At 87.5%, his scores are better than 88%(approximation) of the class.
the percentile for students of VIII grade八年级学生的百分位数
Objective: To compute the percentile for students of VIII grade.
- Input: “Percentile.xlsx”
- The sample data set as available in “Percentile.xlsx”.

 ==>
==>
- Read in the data from “Percentile.xlsx” into Tableau
- Drag the measure “Roll No” from the Measures area under the data pane and place it on the rows shelf(
 ==>Dimension and Discrete==>
 )
)
Drag the measure “CGPA” from the measures area under the data pane and place it on the “Label” on the marks card
- Add a table calculation “Percentile” to the measure “CGPA” placed on the “Label” on the marks card
 ==>
==>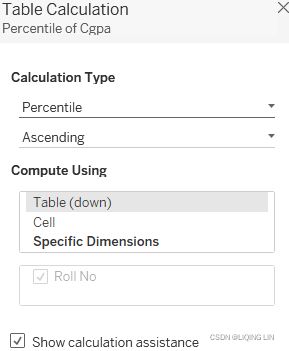 ==>
==>
The formula used in the calculation:
Percentile Rank=(Number of values less than or equal to the value under consideration / Total number of values) * 100
Example: Let us consider the CGPA score for student whose Roll No is 1. The Student’s CGPA score is 4.6. There are eight CGPA scores that are less than or equal to the CGPA score of 4.6.
(8 / 10) * 100 = 80%, 8 since [4.6, 4.2, 4.4, 4.3, 3.9, 5.0, 4.3, 4.4, 4.6,4.7]
but tableau uses RANK_PERCENTILE() and RANK(Descending and Competition(1,2,2,4)) :
:
4.6 ==> RANK ==> (Total rows-Rank)/(Total rows-1)=(10-3=7)/(10-1)=77.78%
4.2 ==> RANK ==> (Total rows-Rank)/(Total rows-1)=(10-9=1)/(10-1)=11.11%
4.4 ==> RANK ==> (Total rows-Rank)/(Total rows-1)=(10-5=5)/(10-1)=55.56%
4.3 ==> RANK ==> (Total rows-Rank)/(Total rows-1)=(10-7=3)/(10-1)=33.33%
3.9 ==> RANK ==> (Total rows-Rank)/(Total rows-1)=(10-10=0)/(10-1)=0.00%
5.0 ==> RANK ==> (Total rows-Rank)/(Total rows-1)=(10-1=9)/(10-1)=100.00%
Here's why RANK can't be in ascending order:
if tableau uses RANK( Ascending and Competition(1,2,2,4) ) to calculate Percentile, then 5.0's Rank is 10, 10/(10-1)=111.11% (wrong)
4.7 ==> RANK ==> (Total rows-Rank)/(Total rows-1)=(10-2=8)/(10-1)=88.89%
But Tableau website tell us, they use RANK_PERCENTILE is calculated as(Rank-1)/(Total rows-1).https://help.tableau.com/current/prep/en-us/prep_calculations.htm#:~:text=Rank_Modified%20is%20calculated%20as%20Rank,of%20duplicate%20rows%20%2D%201)%20.&text=Assigns%20a%20percentile%20rank%20from,to%20PERCENT_RANK()%20in%20SQL.
Let's use RANK(Ascending and Modified Competition(1,3,3,4)) vs
vs
 ==>total number-(Rank_Asc_Modified Competition-1)==>
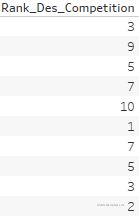
RANK_PERCENTILE is calculated as(Rank-1)/(Total rows-1),this Rank isRANK(Ascending and Modified Competition(1,3,3,4))this code implement Tableau RANK_PERCENTILE()// WINDOW_MAX( RANK(SUM([Cgpa]),'desc') ) return maximum // maximum = the Number of Records (RANK_MODIFIED( SUM([Cgpa]), 'asc' ) -1 )/(WINDOW_MAX( RANK_MODIFIED( SUM([Cgpa]), 'asc' ) ) -1 )
So if you are using RANK(Descending and Competition(1,2,2,4)) to calculate Percentile, then you should use (Total rows-Rank)/(Total rows-1) to to calculate Percentile
for Tableau
if you are using RANK(Ascending and Modified Competition(1,3,3,4)) to calculate Percentile, then you should use (Rank-1)/(Total rows-1) to to calculate Percentile. - Let's go back the example:
Example: Let us consider the CGPA score for student whose Roll No is 1. The Student’s CGPA score is 4.6. There are eight CGPA scores that are less than or equal to the CGPA score of 4.6.
(8 / 10) * 100 = 80%, 8 since [4.6, 4.2, 4.4, 4.3, 3.9, 5.0, 4.3, 4.4, 4.6,4.7]
So we should use RANK(Ascending and Modified Competition(1,3,3,4)) to calculate Percentile since the result of Rank/(Total rows) is that Percentile we want.
OR RANK Result = Number of values less than or equal to the value under consideration
from step 4:
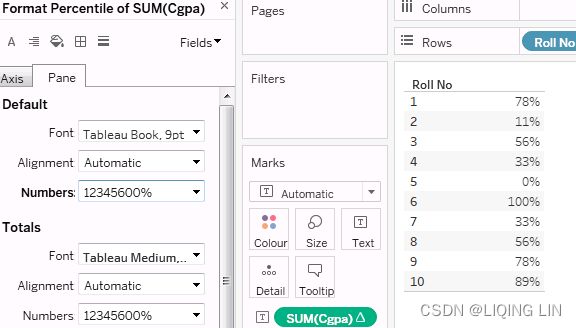
- Create a Calculated Filed named Percentile
we use window_max + rank_modified to get the number of records
// WINDOW_MAX( RANK(SUM([Cgpa]),'desc') ) return maximum // maximum = the Number of Records RANK_MODIFIED( SUM([Cgpa]), 'asc' )/WINDOW_MAX( RANK_MODIFIED( SUM([Cgpa]), 'asc' ) )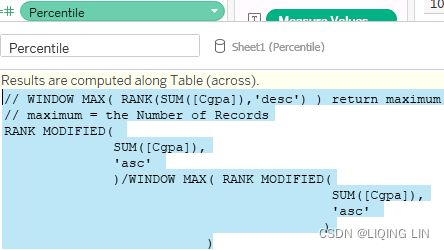 Computing using Table(Down)
 - Double click Percentile

- Edit Alias...

The formula used in the calculation:
(Number of values less than or equal to the value under consideration / Total number of values) * 100
Example: Let us consider the CGPA score for student whose roll number is 1. The Student’s CGPA score is 4.6. There are eight CGPA scores that are less than or equal to the CGPA score of 4.6.
(8 / 10) * 100 = 80%, 8 since [4.6, 4.2, 4.4, 4.3, 3.9, 5.0, 4.3, 4.4, 4.6,4.7]
Now, just to reconfirm the formula, let us consider another student’s CGPA value. This time let us consider the CGPA value of 3.9.
This is the least CGPA score that a student has attained. (1/10)*100 = 10%
While computing percentiles, tableau ignores null values. null values if present appear as blank rows in a cross-tab and do not count towards the total number of items used in the calculation (%).
5.8 Year over Year Growth
In layman’s terms, YOY means the company’s financial performance this year as against last year. YOY performance is used to gauge[ɡeɪdʒ]估计,判断 whether the performance of the company is improving or debilitating[dɪˈbɪlɪteɪtɪŋ]使虚弱.
Formula to compute the Year over year growth:
- • Subtract last year's number (sales or profit) from this year's number. This will constitute the total difference for the year (this number if positive will indicate a year-over-year gain otherwise it implies loss).
- • Divide the difference by last year's number. The result is the year-over-year growth rate.
Year-on-year sales growth
Objective:
Data is provided for 4 years (2016, 2017, 2018 and 2019). The senior executive at the firm would like a visualization that shows the Year over Year growth.
- Input: “Sample – Superstore.xls”
- Expected Output:

- Drag the dimension “Order Date” from the dimensions area under the data pane to the columns shelf. Retain the date hierarchy at the default, i.e. “Year”(Date Value). Retain the “Order Date” at “Discrete”
Drag the measure “Sales” from the measures area under the data pane and place it on the rows shelf
Change the “Mark Type” to “Bar” - Add a “Quick Table Calculation – Year over Year Growth” to the measure “Sales” on the rows shelf
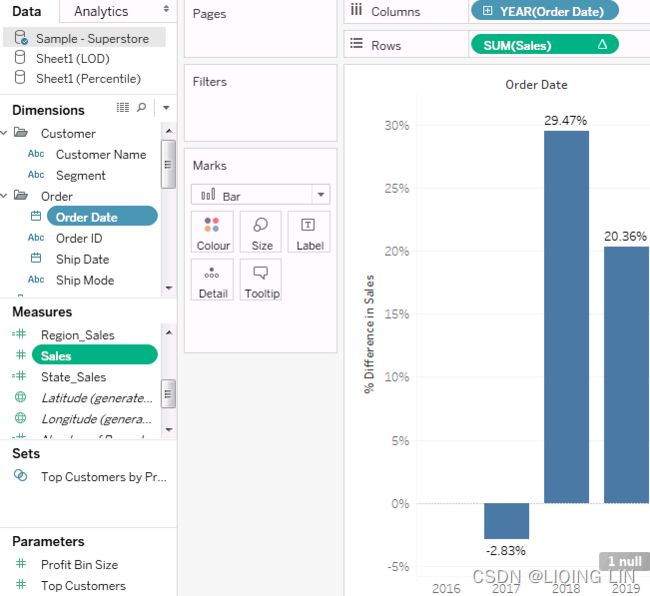
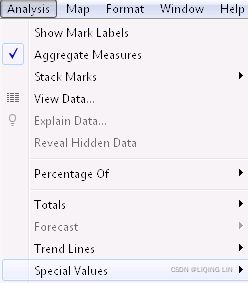
- Click on the message, “1 null” at the bottom of the view/worksheet to bring up the "Special Values for [% Difference in Sales]" dialog box

- Click on “Show Data at Default Position”. The output after considering the null value

- Press “CTRL” and drag the measure “Sales”
 from the rows shelf and place it on “Color” on the marks card==>
Change the stepped color to 2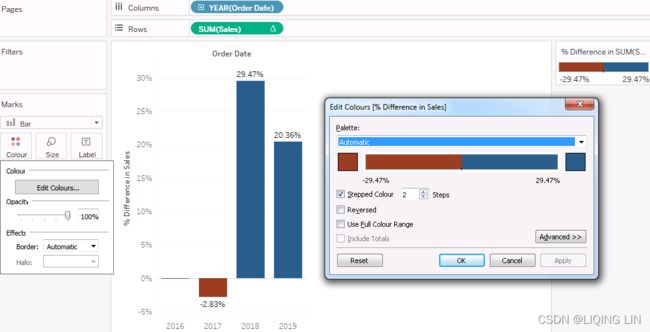
- Press “CTRL” and drag the measure “Sales” from the rows shelf to “Label” on the marks card

Monthly sales growth rate for the years 2016 and 2017
- Objective:
The senior sales executive of “XYZ” corporation would like a visualization that presents the “Month over Month Growth” for the years 2016 and 2017. - Input: “Sample – Superstore.xls”
- Expected Output:
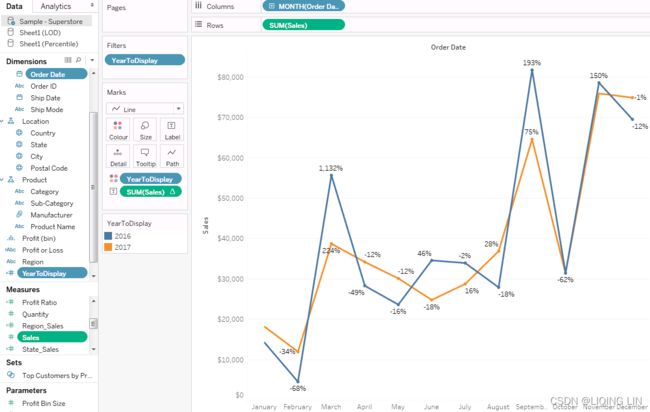
- Create a calculated field, “YearToDisplay”
YEAR([Order Date]) ==>
==> ==>
==>
Convert the calculated field, “YearToDisplay” to “Dimension” - Place the calculated field, “YearToDisplay” on the filters shelf.
Select the years “2016” and “2017” in the filter dialog box
- Place the calculated field, “YearToDisplay” on “Color” on the marks card
- Drag the dimension “Order Date” from the dimensions area under the data pane to the columns shelf. Change the date hierarchy to “Month”(Date value). Retain it as “Discrete”
- Change the “Mark Type” to “Line”
- Drag the measure “Sales” from the measures area under the data pane and place it on the rows shelf
- Drag the measure “Sales” from the measures area under the data pane to “Label” on the marks card
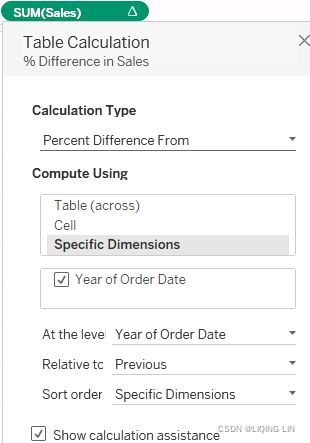
- Add a “Quick Table Calculation – Year over Year Growth” to the measure “Sales” which is placed on the “Label” on the marks card
 Note that the “Percent Difference from” is calculated at the level, “Month of Order Date” and displays the value as a percent difference from “Previous”
Verify the output as follows:Year Month Sales Percent difference 2016 Jan 14,237 Feb 4,520 ( (4,520 - 14,237) / 14,237 ) * 100 = -68% Mar 55,691 ( (55,691 -4,520) / 4,520 ) *100 = 1,132% Apr 28,295 ( (28,295 - 55,691) / 55,691 ) * 100 = -49% May 23,648 ( (23,648 - 28,295) / 28,295 ) *100 = -16% June 34,595
Year over Year Sales Growth only for the years, 2016 and 2017
- Objective:
Data is provided for 4 years (2016, 2017, 2018 and 2019). The senior executive at the firm would like a visualization that shows the Year over Year Growth only for the years, 2016 and 2017. - Input: “Sample – Superstore.xls”
- Expected output: Shown in Fig.
- Create a calculated field, “2016”
IF YEAR([Order Date]) = 2016
    THEN [Sales]
ELSE
    0
END
- Create a calculated field, “2017”
IF YEAR([Order Date]) = 2017
    THEN [Sales]
ELSE
    0
END
- Create a calculated field, “YearOverYearGrowth”
( SUM([2017])- SUM([2016]) ) / SUM([2016])
- Drag the dimension “Measure Names” from the dimensions area under the data pane to the columns shelf
Drag the dimension “Measure Names” from the dimensions area under the data pane to the filters shelf
Select the measures, “2016”, “2017” and “YearOverYearGrowth”.
Drag the measure “Measure Values” from the measures area under the data pane and place it on “Label” on the marks card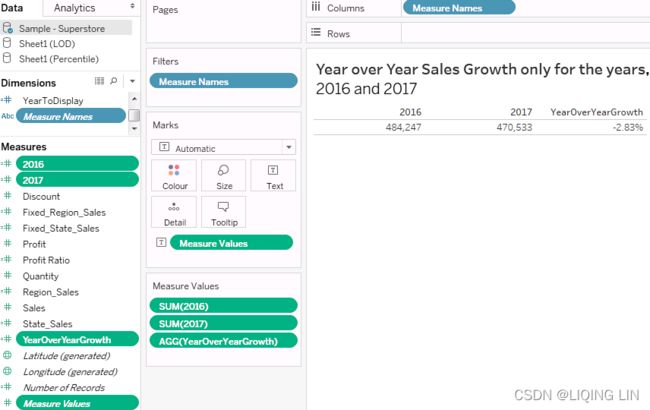
5.9 Points to remember
- • Table calculations aid in deriving additional insights from data.
For example:- (a) it helps to compare growth or differences across time periods (Year over year growth).
- (b) It helps to compute running total (running total) of inventory. The product list grows as products are added each day.
- • There are ways in which table calculations can be customized such as by using its context menu
 or the calculation editor. To bring up the context menu, click on any field.
 - • Table calculations are generally applied to values in the entire table.
For example to compute the running total or running average, a single method of calculation needs to be applied to the entire table.