【CV】使用 matplotlib 画统计图,并用 OpenCV 显示静图和动图
1. 效果
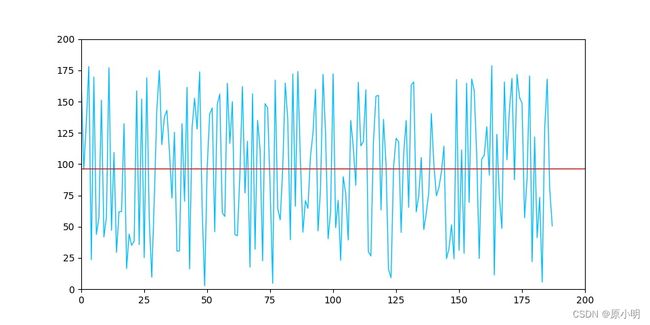
静图
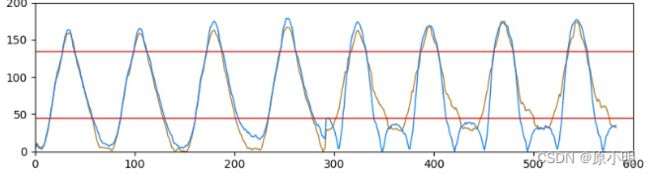
动图
2.思路
- 准备数据
- 使用 pyplot 画统计图
- 图片写入流,流转图(numpy)
- matplotlib 颜色 RGB 转 OpenCV 颜色 BRG
4. 静图
代码过程有注释,很简单的实现。注意 matplotlib RGB 转 OpenCV BGR image = image[:, :, ::-1] ,否则颜色不一致。
#!/usr/bin/env python
# -*- encoding: utf-8 -*-

"""
@Create  :   2024/01/15 16:22:44
@Author  :   Yuan Mingzhuo
"""

import cv2
import numpy as np
import math
import random

# 统计图
import io
from PIL import Image
import matplotlib.pyplot as plt


# 尺寸: 960x480
plt.figure(figsize=(9.6, 4.8))


def draw_charts():
    """
    画图
    """
    # 数据
    values = [random.random() for i in range(150)]
    # 清空
    plt.clf()
    # 线条
    plt.plot(values, linewidth=1, color="deepskyblue")
    plt.axis((0, 200, 0, 1))
    plt.axhline(y=(sum(values) / len(values)), linewidth=1, color="r")
    # 图写入流
    buffer = io.BytesIO()
    plt.savefig(buffer)
    # 流转图片
    image = Image.open(buffer)
    image = np.asarray(image)
    image = image[:, :, :3]
    # matplotlib RGB 转 OpenCV BGR
    image = image[:, :, ::-1]
    cv2.imwrite("test.jpg", image)

if __name__ == "__main__":
    draw_charts()
5. 动图
思路,更新数据时,重新绘制统计图。
- x 轴不变,数据集 values 保持 x 轴的数量即可,自行实现;
- x 轴变化,数据集 values 的数量变化而变化;

代码过程有注释,很简单的实现。注意 matplotlib RGB 转 OpenCV BGR image = image[:, :, ::-1] ,否则颜色不一致。
#!/usr/bin/env python
# -*- encoding: utf-8 -*-

"""
@Create  :   2024/01/15 16:22:44
@Author  :   Yuan Mingzhuo
"""

import cv2
import numpy as np
import math
import random

# 统计图
import io
from PIL import Image
import matplotlib.pyplot as plt


# 尺寸: 960x480
plt.figure(figsize=(9.6, 4.8))


def draw_chart(values):
    """
    画图
    """
    buffer = io.BytesIO()
    # 清空
    plt.clf()
    plt.plot(values, linewidth=1, color="deepskyblue")
    axis_x = math.ceil(len(values) / 100) * 100
    plt.axis((0, axis_x, 0, 200))
    plt.axhline(y=(sum(values) / len(values)), linewidth=1, color="r")
    plt.savefig(buffer)
    # 获取图
    image = Image.open(buffer)
    image = np.asarray(image)
    image = image[:, :, :3]
    # matplotlib RGB 转 OpenCV BGR
    image = image[:, :, ::-1]
    # print(image.shape)
    # cv2.imwrite("test.jpg", image)
    return image

if __name__ == "__main__":
    # 数据
    values = []
    for i in range(1800):
        # 更新数据
        values.append(random.random() * 180)
        # 重新画图
        image = draw_chart(values)
        # 显示
        cv2.imshow("test", image)
        cv2.waitKey(100)
6. 多图
效果
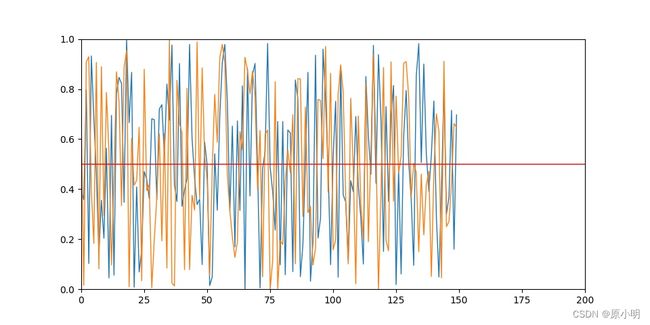
代码
#!/usr/bin/env python
# -*- encoding: utf-8 -*-

"""
@Create  :   2024/01/15 16:22:44
@Author  :   Yuan Mingzhuo
"""

import cv2
import numpy as np
import math
import random

# 统计图
import io
from PIL import Image
import matplotlib.pyplot as plt


# 尺寸: 960x480
plt.figure(figsize=(9.6, 4.8))


def draw_charts():
    """
    画图
    """
    # 数据
    values_a = [random.random() for i in range(150)]
    values_b = [random.random() for i in range(150)]
    values = [values_a, values_b]
    # 清空
    plt.clf()
    # 线条
    for value in values:
        plt.plot(value, linewidth=1)
    # 坐标轴
    plt.axis((0, 200, 0, 1))
    # 辅助线
    plt.axhline(y=0.5, linewidth=1, color="r")
    # 图写入流
    buffer = io.BytesIO()
    plt.savefig(buffer)
    # 流转图片
    image = Image.open(buffer)
    image = np.asarray(image)
    image = image[:, :, :3]
    # matplotlib RGB 转 OpenCV BGR
    image = image[:, :, ::-1]
    cv2.imwrite("test.jpg", image)


if __name__ == "__main__":
    draw_charts()
7.应用
视觉计算时,可直接显示变化过程,减少先保存数据再绘制图的过程