Prometheus监控系统
基础环境
[root@localhost ~]# hostnamectl set-hostname prometheus-server
[root@localhost ~]# bash
[root@prometheus-server ~]# systemctl disable firewalld --now && setenforce 0
[root@prometheus-server ~]# sed -i 's/SELINUX=enforcing/SELINUX=disabled/g' /etc/selinux/config

[root@prometheus-server ~]# mv /etc/yum.repos.d/CentOS-* /tmp/
[root@prometheus-server ~]# curl -o /etc/yum.repos.d/centos.repo http://mirrors.aliyun.com/repo/Centos-7.repo
[root@prometheus-server ~]# curl -o /etc/yum.repos.d/epel.repo http://mirrors.aliyun.com/repo/epel-7.repo
安装prometheus组件说明:
Prometheus Server: 普罗米修斯的主服务器,端口号9090
NodeEXporter: 负责收集Host硬件信息和操作系统信息,端口号9100
cAdvisor:负责收集Host上运行的容器信息,端口号占用8080
Grafana:负责展示普罗米修斯监控界面,端口号3000
Altermanager:等待接收prometheus发过来的告警信息,altermanager再发送给定义的收件人
Prometheus部署
解压二进制包
[rootprometheus-server prometheus-2.28.0]# cd /usr/local/src/
[root@prometheus-server prometheus-2.28.0]# tar -zxvf prometheus-2.28.0.linux-amd64.tar.gz
[root@prometheus-server prometheus-2.28.0]# mv prometheus-2.28.0.linux-amd64 prometheus-2.28.0
添加systemd管理
[root@prometheus-server prometheus-2.28.0]# cat /usr/lib/systemd/system/prometheus.service
[Unit]
Description=prometheus
[Service]
ExecStart=/usr/local/src/prometheus-2.28.0/prometheus --config.file=/usr/local/src/prometheus-2.28.0/prometheus.yml
ExecReload=/bin/kill -HUP $MAINPID
KillMode=process
Restart=on-failure
[Install]
WantedBy=multi-user.target
加载配置并启动
[root@prometheus-server prometheus-2.28.0]# systemctl daemon-reload
[root@prometheus-server prometheus-2.28.0]# systemctl restart prometheus
[root@prometheus-server prometheus-2.28.0]# systemctl enable prometheus --now
Created symlink from /etc/systemd/system/multi-user.target.wants/prometheus.service to /usr/lib/systemd/system/prometheus.service.

[root@prometheus-server prometheus-2.28.0]# cat prometheus.yml
# my global config
global:
  scrape_interval:     15s # Set the scrape interval to every 15 seconds. Default is every 1 minute.
  evaluation_interval: 15s # Evaluate rules every 15 seconds. The default is every 1 minute.
  # scrape_timeout is set to the global default (10s).

# Alertmanager configuration
alerting:
  alertmanagers:
  - static_configs:
    - targets:
      # - alertmanager:9093    # 开启alertmanager告警,去掉 # 号即可

# Load rules once and periodically evaluate them according to the global 'evaluation_interval'.
rule_files:
  # - "first_rules.yml"      # prometheus读取监控的数据文件
  # - "second_rules.yml"

# A scrape configuration containing exactly one endpoint to scrape:
# Here it's Prometheus itself.
scrape_configs:
  # The job name is added as a label `job=` to any timeseries scraped from this config.
  - job_name: 'prometheus'

    # metrics_path defaults to '/metrics'
    # scheme defaults to 'http'.

    static_configs:
    - targets: ['localhost:9090']

  - job_name: 'node server'
    static_configs:
     - targets: ['192.168.33.145:9100','192.168.33.142:9100']    # 监控 node_exporter 数据,主要监控node节点数据(内存,cpu,负载等)

  - job_name: 'docker'
    static_configs:
     - targets: ['192.168.33.145:8080']       #  cadvisor 服务,主要监控docker数据
[root@prometheus-server prometheus-2.28.0]# ps -ef | grep prometheus
root       2075      1  0 03:55 ?        00:00:00 /usr/local/src/prometheus-2.28.0/prometheus --config.file=/usr/local/src/prometheus-2.28.0/prometheus.yml
root       2152   1745  0 04:06 pts/0    00:00:00 grep --color=auto prometheus
[root@prometheus-server prometheus-2.28.0]# netstat -ntpl
Active Internet connections (only servers)
Proto Recv-Q Send-Q Local Address           Foreign Address         State       PID/Program name
tcp        0      0 0.0.0.0:22              0.0.0.0:*               LISTEN      1029/sshd
tcp        0      0 127.0.0.1:25            0.0.0.0:*               LISTEN      1161/master
tcp6       0      0 :::9090                 :::*                    LISTEN      2075/prometheus
tcp6       0      0 :::22                   :::*                    LISTEN      1029/sshd
tcp6       0      0 ::1:25                  :::*                    LISTEN      1161/master

node_exporter部署
解压二进制包
[root@prometheus-server node_exporter-1.2.2]# tar -zxvf node_exporter-1.2.2.linux-amd64.tar.gz
[root@prometheus-server node_exporter-1.2.2]# mv node_exporter-1.2.2.linux-amd64 node_exporter-1.2.2
添加systemd管理
[root@prometheus-server node_exporter-1.2.2]# cat /usr/lib/systemd/system/node_exporter.service
[Unit]
Description=node_exporter
[Service]
ExecStart=/usr/local/src/node_exporter-1.2.2/node_exporter  --collector.systemd --collector.systemd.unit-include=(docker|sshd|nginx).service
ExecReload=/bin/kill -HUP $MAINPID
KillMode=process
Restart=on-failure
[Install]
WantedBy=multi-user.target
加载配置并启动
[root@prometheus-server node_exporter-1.2.2]# systemctl daemon-reload
[root@prometheus-server node_exporter-1.2.2]# systemctl enable node_exporter --now
Created symlink from /etc/systemd/system/multi-user.target.wants/node_exporter.service to /usr/lib/systemd/system/node_exporter.service.
grafana部署
解压二进制包
[root@prometheus-server grafana-8.0.3]# tar -zxvf grafana-enterprise-8.0.3.linux-amd64.tar.gz
添加systemd管理
[root@prometheus-server grafana-8.0.3]# cat /usr/lib/systemd/system/grafana.service
[Unit]
Description=grafana
[Service]
ExecStart=/usr/local/src/grafana-8.0.3/bin/grafana-server -homepath=/usr/local/src/grafana-8.0.3
ExecReload=/bin/kill -HUP $MAINPID
KillMode=process
Restart=on-failure
[Install]
WantedBy=multi-user.target
加载配置并启动
[root@prometheus-server grafana-8.0.3]# systemctl daemon-reload
[root@prometheus-server grafana-8.0.3]# systemctl enable grafana --now
Created symlink from /etc/systemd/system/multi-user.target.wants/grafana.service to /usr/lib/systemd/system/grafana.service.
grafana模板下载地址
https://grafana.com/grafana/dashboards

### 常用模板
193  docke监控r模板
9276  node节点监控模板
7362  mysql监控模板
默认用户/密码 admin/admin

alertmanager部署
解压二进制包
[root@prometheus-server alertmanager-0.23.0]# tar -zxvf alertmanager-0.23.0.linux-amd64.tar.gz
[root@prometheus-server alertmanager-0.23.0]# mv alertmanager-0.23.0.linux-amd64 alertmanager-0.23.0
添加systemd管理
[root@prometheus-server alertmanager-0.23.0]# cat /usr/lib/systemd/system/alertmanager.service
[Unit]
Description=alertmanager
[Service]
ExecStart=/usr/local/src/alertmanager-0.23.0/alertmanager --config.file=/usr/local/src/alertmanager-0.23.0/alertmanager.yml
ExecReload=/bin/kill -HUP $MAINPID
KillMode=process
Restart=on-failure
[Install]
WantedBy=multi-user.target
加载配置并启动
[root@prometheus-server alertmanager-0.23.0]# systemctl daemon-reload
[root@prometheus-server alertmanager-0.23.0]# systemctl enable alertmanager --now
Created symlink from /etc/systemd/system/multi-user.target.wants/alertmanager.service to /usr/lib/systemd/system/alertmanager.service.
重启alertmanager
systemctl restart alertmanager
cadvisor部署
下载二进制包
[root@prometheus-server ~]# wget https://github.com/google/cadvisor/releases/download/v0.37.5/cadvisor
[root@prometheus-server ~]# mv cadvisor /usr/local/bin/
[root@prometheus-server ~]# chmod +x /usr/local/bin/cadvisor
添加systemd管理
[root@prometheus-server ~]# cat /usr/lib/systemd/system/cadvisor.service
[Service]
# 端口 8080
ExecStart=/usr/local/bin/cadvisor -port=8080

[Install]
WantedBy=multi-user.target

[Unit]
Description=cadvisor
After=network.target
加载配置并启动
[root@prometheus-server ~]# systemctl enable cadvisor --now
Created symlink from /etc/systemd/system/multi-user.target.wants/cadvisor.service to /usr/lib/systemd/system/cadvisor.service.

配置Alertmanager报警
启动 AlertManager 来接受 Prometheus 发送过来的报警信息,并执行各种方式的报警。
alertmanager与prometheus工作流程如下

prometheus收集监测的信息
prometheus.yml文件定义rules文件,rules里包括了告警信息
prometheus把报警信息push给alertmanager ,alertmanager里面有定义收件人和发件人
alertmanager发送文件给邮箱或微信
告警等级
Inactive		### 正常
Pending			### 已触发阈值,但未满足告警持续时间
Firing			### 已触发阈值且满足告警持续时间,警报发送给接受者
AlertManager 默认配置文件为 alertmanager.yml,在容器内路径为/etc/alertmanager/alertmanager.yml
这里 AlertManager 默认启动的端口为 9093,启动完成后,浏览器访问http://:9093 可以看到默认提供的 UI 页面,不过现在是没有任何告警信息的,因为我们还没有配置报警规则来触发报警

[root@prometheus-server alertmanager-0.23.0]# cat alertmanager.yml
#route:
#  group_by: ['alertname']
#  group_wait: 30s
#  group_interval: 5m
#  repeat_interval: 1h
#  receiver: 'web.hook'
#receivers:
#- name: 'web.hook'
#  webhook_configs:
#  - url: 'http://127.0.0.1:5001/'
#inhibit_rules:
#  - source_match:
#      severity: 'critical'
#    target_match:
#      severity: 'warning'
#    equal: ['alertname', 'dev', 'instance']

global:
  resolve_timeout: 5m
  smtp_from: '[email protected]'						### 定义发送的邮箱
  smtp_smarthost: 'smtp.qq.com:465'
  smtp_auth_username: '[email protected]'
  smtp_auth_password: 'xxx'
  smtp_require_tls: false
  smtp_hello: 'qq.com'
route:
  group_by: ['alertname']
  group_wait: 5s
  group_interval: 5s
  repeat_interval: 5m
  receiver: 'email'
receivers:
- name: 'email'
  email_configs:
  - to: '[email protected]'									### 定义接受的邮箱
    send_resolved: true
inhibit_rules:
  - source_match:
      severity: 'critical'
    target_match:
      severity: 'warning'
    equal: ['alertname', 'dev', 'instance']
简单介绍一下主要配置的作用:简单介绍一下主要配置的作用:
global: 全局配置,包括报警解决后的超时时间、SMTP 相关配置、各种渠道通知的 API 地址等等。
route: 用来设置报警的分发策略,它是一个树状结构,按照深度优先从左向右的顺序进行匹配。
receivers: 配置告警消息接受者信息,例如常用的 email、wechat、slack、webhook 等消息通知方式。
inhibit_rules: 抑制规则配置,当存在与另一组匹配的警报(源)时,抑制规则将禁用与一组匹配的报警(目标)。

prometheus添加alertmanager报警规则
在 Prometheus 配置 AlertManager 服务地址以及告警规则,新建报警规则文件 node-up.rules
[root@prometheus-server prometheus-2.28.0]# mkdir rules
[root@prometheus-server prometheus-2.28.0]# cat rules/node-up.rules
groups:
- name: node-up
  rules:
  - alert: node-up
    expr: up{job="docker"} == 0			### job_name 是在 prometheus.yml 里面设置
    for: 15s
    labels:
      severity: 1
      team: node
    annotations:
      summary: "{{ $labels.instance }} 已停止运行超过 15s!"
修改prometheus.yml文件,添加rules规则
这里 rule_files 为容器内路径,需要将本地 node-up.rules 文件挂载到容器内指定路径,修改 Prometheus 启动命令如下,并重启服务。
[root@prometheus-server prometheus-2.28.0]# cat prometheus.yml
# my global config
global:
  scrape_interval:     15s # Set the scrape interval to every 15 seconds. Default is every 1 minute.
  evaluation_interval: 15s # Evaluate rules every 15 seconds. The default is every 1 minute.

alerting:
  alertmanagers:
  - static_configs:
    - targets:
      # - alertmanager:9093
      - 192.168.169.206:9093

rule_files:
  - "/usr/local/src/prometheus-2.28.0/rules/*.rules"

scrape_configs:
  - job_name: 'prometheus'

    static_configs:
    - targets: ['localhost:9090']

  - job_name: 'linux'
    static_configs:
    - targets: ['192.168.169.206:9100']

  - job_name: 'docker'
    static_configs:
    - targets: ['192.168.169.206:8080']
在prometheus上查看相应的规则
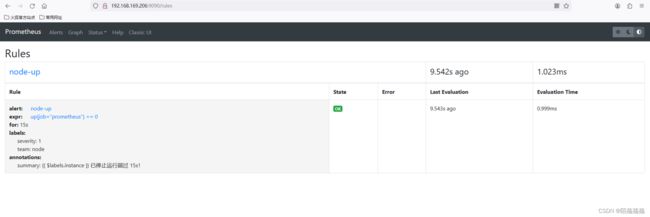
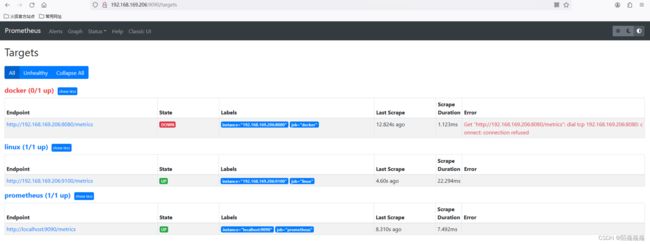
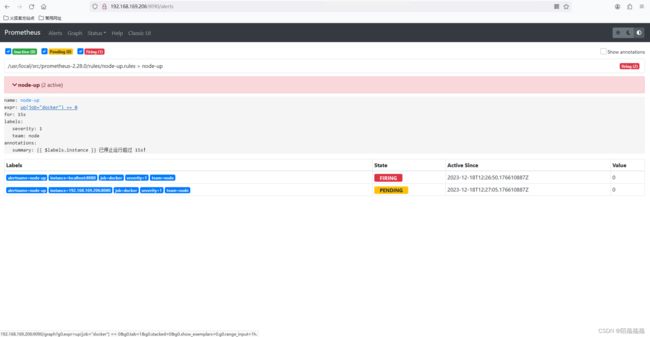
触发报警发送邮件
[root@prometheus-server prometheus-2.28.0]# systemctl stop cadvisor
[root@prometheus-server prometheus-2.28.0]# systemctl status cadvisor
● cadvisor.service - cadvisor
   Loaded: loaded (/usr/lib/systemd/system/cadvisor.service; enabled; vendor preset: disabled)
   Active: inactive (dead) since Mon 2023-12-18 19:54:54 CST; 1h 1min ago
  Process: 14887 ExecStart=/usr/local/bin/cadvisor -port=8080 (code=exited, status=0/SUCCESS)
 Main PID: 14887 (code=exited, status=0/SUCCESS)

Dec 18 10:19:10 prometheus-server systemd[1]: Started cadvisor.
Dec 18 19:54:54 prometheus-server systemd[1]: Stopping cadvisor...
Dec 18 19:54:54 prometheus-server cadvisor[14887]: I1218 19:54:54.883895   14887 manager.go:1185] Exiting thread watching subcontainers
Dec 18 19:54:54 prometheus-server cadvisor[14887]: I1218 19:54:54.884555   14887 manager.go:403] Exiting global housekeeping thread
Dec 18 19:54:54 prometheus-server cadvisor[14887]: I1218 19:54:54.884644   14887 cadvisor.go:245] Exiting given signal: terminated
Dec 18 19:54:54 prometheus-server systemd[1]: Stopped cadvisor.
alertmanager自定义邮件报警
[root@prometheus-server alertmanager-0.23.0]# cat template/email.tmpl
{{ define "email.from" }}[email protected]{{ end }}
{{ define "email.to" }}[email protected]{{ end }}
{{ define "email.to.html" }}
{{ range .Alerts }}
====================start====================<br>
告警程序: prometheus_alert <br>
告警级别: {{ .Labels.severity }} 级 <br>
告警类型: {{ .Labels.alertname }} <br>
故障主机: {{ .Labels.instance }} <br>
告警主题: {{ .Annotations.summary }} <br>
告警详情: {{ .Annotations.description }} <br>
触发时间: {{ (.StartsAt.Add 28800e9).Format "2006-01-02 15:04:05" }} <br>
=====================end=====================<br>
{{ end }}
{{ end }}

[root@prometheus-server alertmanager-0.23.0]# cat alertmanager.yml
global:
  resolve_timeout: 5m
  smtp_from: '[email protected]'
  smtp_smarthost: 'smtp.qq.com:465'
  smtp_auth_username: '[email protected]'
  smtp_auth_password: 'xxx'
  smtp_require_tls: false
  smtp_hello: 'qq.com'

templates:
  - '/usr/local/src/alertmanager-0.23.0/template/*.tmpl'

route:
  group_by: ['alertname']
  group_wait: 5s
  group_interval: 5s
  repeat_interval: 5m
  receiver: 'email'

receivers:
- name: 'email'
  email_configs:
  - to: '[email protected]'
    html: '{{ template "email.to.html" . }}'

inhibit_rules:
  - source_match:
      severity: 'critical'
    target_match:
      severity: 'warning'
    equal: ['alertname', 'dev', 'instance']
测试
