Arthas的简单使用
Arthas
Arthas 是一个开源的 Java 诊断工具,旨在帮助开发者和运维人员更轻松地定位和解决 Java 应用程序的性能问题。
- 实时诊断:
- Arthas 提供了实时的诊断功能,可以帮助你监视应用程序的性能,包括 CPU 使用率、内存使用情况、线程状态等。通过实时诊断,你可以及时发现潜在的性能问题。
- 代码追踪和分析:
- Arthas 允许你对 Java 方法进行追踪和分析,以了解方法的执行时间、调用链等信息。这对于查找性能瓶颈和优化代码非常有帮助。
- 动态修改类和方法:
- Arthas 具有动态修改类和方法的能力。这意味着你可以在应用程序运行时修改类的代码,插入自定义的逻辑,而无需重启应用。这对于调试和排查问题非常方便。
- 查看 JVM 运行时信息:
- Arthas 允许你查看 JVM 的运行时信息,包括类加载情况、内存使用情况、垃圾回收统计等。这对于深入了解应用程序的运行环境非常有帮助。
- 查看应用程序的配置信息:
- 通过 Arthas,你可以查看应用程序的配置信息,包括系统属性、环境变量等。这有助于排查一些配置相关的问题。
- 在线排查问题:
- Arthas 支持在线排查问题,比如查看线程堆栈、检查死锁等。这对于发现和解决线上问题非常有帮助。
- 应用程序诊断和调试:
- Arthas 提供了一系列的命令和功能,支持应用程序的诊断和调试。你可以通过它来查看变量的值、执行代码片段等。
具体使用(阿尔萨斯)
官方文档:简介 | arthas (aliyun.com)
maven 仓库拉取
https://arthas.aliyun.com/download/latest_version?mirror=aliyun
github下载:
https://github.com/alibaba/arthas/releases
再IDEA中帮助生成Bash命令的插件
Versions: arthas idea - IntelliJ IDEs Plugin | Marketplace (jetbrains.com)
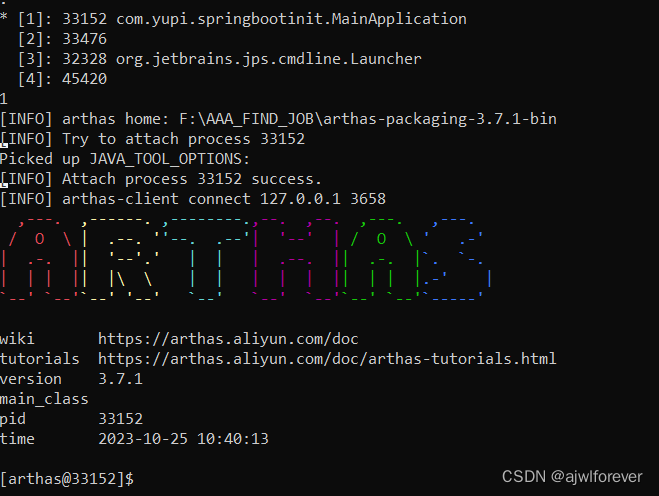
// 启动Arthas
java -jar arthas-boot.jar

输入序号表明要诊断的Java程序;之后接入arthas cmd界面
1 monitor和trace区别
在 Arthas 中,monitor 和 trace 是两个用于监控和追踪 Java 方法执行的命令,它们有一些区别:
-
monitor命令:monitor命令用于监控方法的执行情况,包括方法的入口、执行时间、异常等信息。- 通过
monitor命令可以实时观察方法的执行状况,了解方法调用的频率、耗时等。 monitor命令会以一定的频率采集方法的执行信息,可以通过参数指定采样间隔和次数。
# 例子:监控 com.example.MyClass 中的 myMethod 方法 $ monitor -c 5 com.example.MyClass myMethod -
trace命令:trace命令用于追踪方法的执行过程,会输出方法的调用栈,显示每个方法调用的参数和返回值。trace命令适用于深入了解方法的调用链,对于排查问题和理解代码执行流程非常有帮助。trace命令可以指定深度,控制输出的调用深度。
# 例子:追踪 com.example.MyClass 中的 myMethod 方法的调用栈
$ trace com.example.MyClass myMethod
总的来说,monitor 主要用于监控方法的执行情况,关注方法的入口、执行时间等;而 trace 则更注重于追踪方法的调用链,帮助理解代码执行流程。在实际使用中,可以根据具体需求选择合适的命令。需要注意的是,由于 trace 命令输出的信息可能较为详细,对于频繁调用的方法,可能会导致输出信息过多。
常用命令
1. help 显示arthas的所有命令
help 显示arthas的所有命令
[arthas@33152]$ help
 NAME         DESCRIPTION
 help         Display Arthas Help
 auth         Authenticates the current session
 keymap       Display all the available keymap for the specified connection.
 sc           Search all the classes loaded by JVM
 sm           Search the method of classes loaded by JVM
 classloader  Show classloader info
 jad          Decompile class
 getstatic    Show the static field of a class
 monitor      Monitor method execution statistics, e.g. total/success/failure count, average rt, fail rate, etc.
 stack        Display the stack trace for the specified class and method
 thread       Display thread info, thread stack
 trace        Trace the execution time of specified method invocation.
 watch        Display the input/output parameter, return object, and thrown exception of specified method invocation
 tt           Time Tunnel
 jvm          Display the target JVM information
 memory       Display jvm memory info.
 perfcounter  Display the perf counter information.
 ognl         Execute ognl expression.
 mc           Memory compiler, compiles java files into bytecode and class files in memory.
 redefine     Redefine classes. @see Instrumentation#redefineClasses(ClassDefinition...)
 retransform  Retransform classes. @see Instrumentation#retransformClasses(Class...)
 dashboard    Overview of target jvm's thread, memory, gc, vm, tomcat info.
 dump         Dump class byte array from JVM
 heapdump     Heap dump
 options      View and change various Arthas options
 cls          Clear the screen
 reset        Reset all the enhanced classes
 version      Display Arthas version
 session      Display current session information
 sysprop      Display and change the system properties.
 sysenv       Display the system env.
 vmoption     Display, and update the vm diagnostic options.
 logger       Print logger info, and update the logger level
 history      Display command history
 cat          Concatenate and print files
 base64       Encode and decode using Base64 representation
 echo         write arguments to the standard output
 pwd          Return working directory name
 mbean        Display the mbean information
 grep         grep command for pipes.
 tee          tee command for pipes.
 profiler     Async Profiler. https://github.com/jvm-profiling-tools/async-profiler
 vmtool       jvm tool
 stop         Stop/Shutdown Arthas server and exit the console.
 jfr          Java Flight Recorder Command
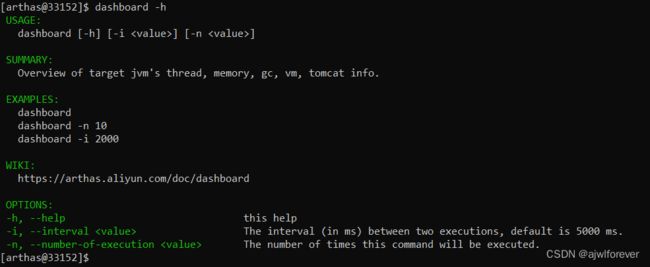
- 具体命令后 -h 显示该命令的用法
dashboard -h
thread -b 死锁线程
2. thread 显示所有线程
[arthas@33152]$ thread -h
 USAGE:
   thread [--all] [-h] [-b] [--lockedMonitors] [--lockedSynchronizers] [-i <value>] [--state <value>] [-n <value>] [id
 ]

 SUMMARY:
   Display thread info, thread stack

 EXAMPLES:
   thread
   thread 51
   thread -n -1
   thread -n 5
   thread -b
   thread -i 2000
   thread --state BLOCKED

 WIKI:
   https://arthas.aliyun.com/doc/thread

 OPTIONS:
     --all                               Display all thread results instead of the first page
 -h, --help                              this help
 -b, --include-blocking-thread           Find the thread who is holding a lock that blocks the most number of threads.
     --lockedMonitors                    Find the thread info with lockedMonitors flag, default value is false.
     --lockedSynchronizers               Find the thread info with lockedSynchronizers flag, default value is false.
 -i, --sample-interval <value>           Specify the sampling interval (in ms) when calculating cpu usage.
     --state <value>                     Display the thead filter by the state. NEW, RUNNABLE, TIMED_WAITING, WAITING,
                                          BLOCKED, TERMINATED is optional.
 -n, --top-n-threads <value>             The number of thread(s) to show, ordered by cpu utilization, -1 to show all.
 <id>                                    Show thread stack
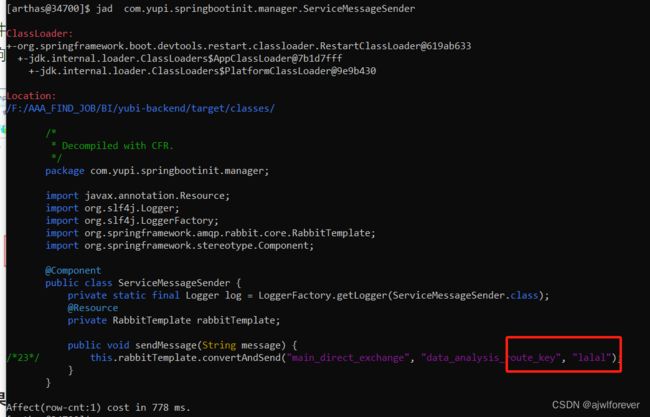
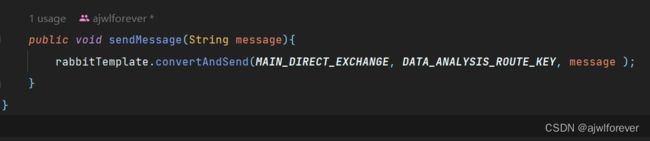
3. jad 反编译+ 类名
jad | arthas (aliyun.com)
[arthas@74768]$ jad com.yupi.springbootinit.Arthas.MultithreadTest

ClassLoader:
+-jdk.internal.loader.ClassLoaders$AppClassLoader@7b1d7fff
  +-jdk.internal.loader.ClassLoaders$PlatformClassLoader@73291f94

Location:
/F:/AAA_FIND_JOB/BI/yubi-backend/target/test-classes/

       /*
        * Decompiled with CFR.
        */
       package com.yupi.springbootinit.Arthas;

       public class MultithreadTest {
           public void mustSayYes() {
/* 9*/         System.out.println("Please enter");
/*10*/         this.sayYes();
           }

           public void sayYes() {
/*14*/         System.out.println("say yesa");
           }
       }

Affect(row-cnt:1) cost in 734 ms.
看线上的代码与线下有什么不同
trace 跟踪
线上有一个接口很慢,用trace跟踪
5. stack 看调用栈
6. monitor 检测
做压测的时候用
7. dashboard
8. tt 时空隧道
对于一个最基本的使用来说,就是记录下当前方法的每次调用环境现场。
9. 热力图
profiler | arthas (aliyun.com)
Spring 项目实战
1.尝试trace 用户登录操作看是否有空间优化
trace com.yupi.springbootinit.service.impl.UserServiceImpl userLogin -n 5 --skipJDKMethod false // 追踪UserLogin这个函数
看结果:
Press Q or Ctrl+C to abort.
Affect(class count: 2 , method count: 2) cost in 107 ms, listenerId: 5
`---ts=2023-10-25 15:01:26;thread_name=http-nio-0.0.0.0-8101-exec-5;id=78;is_daemon=true;priority=5;TCCL=org.springframework.boot.web.embedded.tomcat.TomcatEmbeddedWebappClassLoader@5b57aafc
    `---[6.7177ms] com.yupi.springbootinit.service.impl.UserServiceImpl$$EnhancerBySpringCGLIB$$e42ef7ce:userLogin()
        `---[99.48% 6.682899ms ] org.springframework.cglib.proxy.MethodInterceptor:intercept()
            `---[99.31% 6.636801ms ] com.yupi.springbootinit.service.impl.UserServiceImpl:userLogin()
                +---[0.37% 0.0248ms ] org.apache.commons.lang3.StringUtils:isAnyBlank() #85
                +---[0.12% 0.0078ms ] java.lang.String:length() #88
                +---[0.08% 0.0051ms ] java.lang.String:length() #91
                +---[0.15% 0.01ms ] java.lang.StringBuilder:() #95
                +---[0.23% min=0.0061ms,max=0.0094ms,total=0.0155ms,count=2] java.lang.StringBuilder:append() #95
                +---[0.12% 0.0078ms ] java.lang.StringBuilder:toString() #95
                +---[0.09% 0.005799ms ] java.lang.String:getBytes() #95
                +---[1.38% 0.0916ms ] org.springframework.util.DigestUtils:md5DigestAsHex() #95
                +---[0.31% 0.0204ms ] com.baomidou.mybatisplus.core.conditions.query.QueryWrapper:() #97
                +---[0.56% 0.037ms ] com.baomidou.mybatisplus.core.conditions.query.QueryWrapper:eq() #98
                +---[0.12% 0.0082ms ] com.baomidou.mybatisplus.core.conditions.query.QueryWrapper:eq() #99
                +---[89.84% 5.9625ms ] com.yupi.springbootinit.mapper.UserMapper:selectOne() #100
                +---[0.26% 0.0175ms ] javax.servlet.http.HttpServletRequest:getSession() #107
                +---[0.36% 0.023599ms ] javax.servlet.http.HttpSession:setAttribute() #107
                `---[2.31% 0.1536ms ] com.yupi.springbootinit.service.impl.UserServiceImpl:getLoginUserVO() #108
我们看最重要的2个耗时:
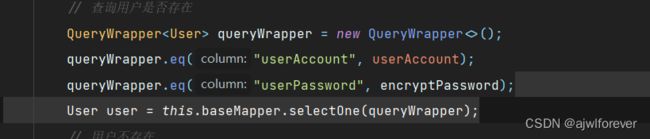
- 第一个是数据库的查询判断操作
com.baomidou.mybatisplus.core.conditions.query.QueryWrapper:eq() #99
                +---[89.84% 5.9625ms ]
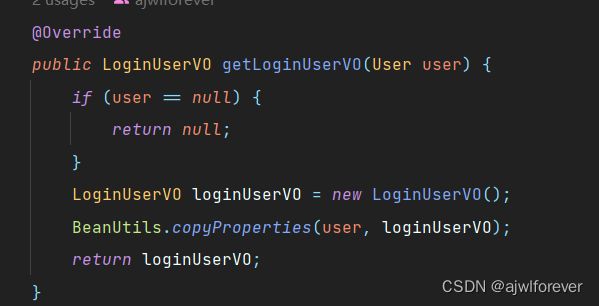
- 第二个是类复制操作
=---[2.31% 0.1536ms ] com.yupi.springbootinit.service.impl.UserServiceImpl:getLoginUserVO() #108
没啥优化空间。