python绘制三维图
文章目录
-
- 语法
-
- plt.figure()
- subplot创建单个子图
- subplots
- add_subplots
- add_axes
- 绘制空白的三维图形
- 散点图绘制
- 线框图
- 表面图
语法
plt.figure()
figure(num=None, figsize=None, dpi=None, facecolor=None, edgecolor=None, frameon=True)
- num:图像编号或名称,数字为编号 ,字符串为名称
figsize:指定figure的宽和高,单位为英寸;
dpi参数指定绘图对象的分辨率,即每英寸多少个像素,缺省值为80 1英寸等于2.5cm,A4纸是 21*30cm的纸张
facecolor:背景颜色
edgecolor:边框颜色
frameon:是否显示边框
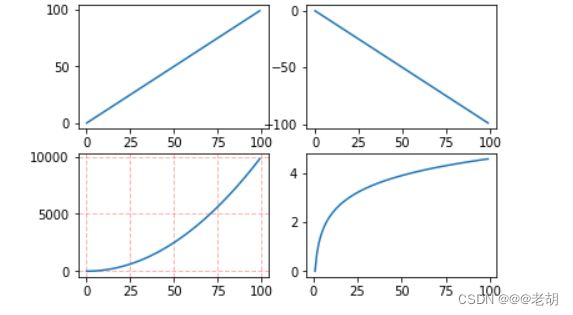
subplot创建单个子图
subplot 可以规划figure划分为n个子图,但是每条subplot命令只会创建一个子图
subplot(nrows,ncols,sharex,sharey,subplot_kw,**fig_kw)
- nrows:subplot的行数
- ncols:subplot的列数
- sharex:所有subplot应该使用相同的x轴刻度(调节xlim将会影响所有的subplot)
- sharey:所有subplot应该使用相同的y轴刻度(调节ylim将会影响所有的subplot)
- subplot_kw:用于创建各个subplot的关键字字典
**fig_kw:创建figure时的其他关键字,如 plt.subplots(2,2,figsize=(8,6))
import matplotlib.pyplot as plt
import numpy as np

x=np.arange(0,100)
# 作图1
plt.subplot(221)
plt.plot(x,x)


# 作图2
plt.subplot(222)
plt.plot(x,-x)

# 作图3
plt.subplot(223)
plt.plot(x,x**2)

# 作图4
plt.subplot(224)
plt.plot(x,np.log(x))
plt.show()

subplots
subplots的参数与subplot的相似
import numpy as np
import matplotlib.pyplot

x=np.arange(0,100)
# 划分子图
flg,axes=plt.subplots(2,2)
ax1=axes[0,0]
ax2=axes[0,1]
ax3=axes[1,0]
ax4=axes[1,1]

ax1.plot(x,x)
ax2.plot(x,-x)
ax3.plot(x,x**2)
ax3.grid(color='r',linestyle='--',linewidth=1,alpha=0.3)
ax4.plot(x,np.log(x))
plt.show()
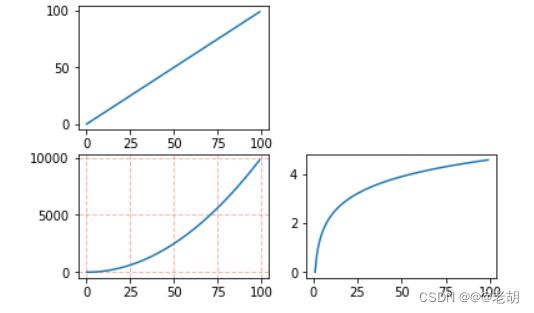
add_subplots
add_subplots的参数与subplots相似
import numpy as np
import matplotlib.pyplot as plt
x = np.arange(0, 100)
#新建figure对象
fig=plt.figure()
#新建子图1
ax1=fig.add_subplot(2,2,1)
ax1.plot(x, x)
#新建子图3
ax3=fig.add_subplot(2,2,3)
ax3.plot(x, x ** 2)
ax3.grid(color='r', linestyle='--', linewidth=1,alpha=0.3)
#新建子图4
ax4=fig.add_subplot(2,2,4)
ax4.plot(x, np.log(x))
plt.show()
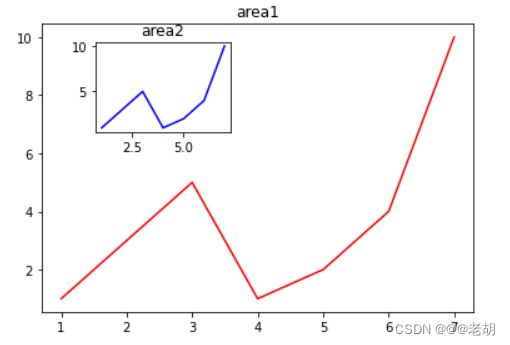
add_axes
用于新增子区域,该区域可以坐落在figure内的任意位置,而且可以设置大小
import numpy as np
import matplotlib.pyplot as plt

# 新建figure
fig=plt.figure()
# 定义数据
x=[1,2,3,4,5,6,7]
y=[1,3,5,1,2,4,10]

# 新建区域ax1
# figure的百分比,从figure 10%开始绘制,宽高是figure的80%
left,botton,width,height=0.1,0.1,0.8,0.8
ax1=fig.add_axes([left,botton,width,height])
ax1.plot(x,y,'r')
ax1.set_title('area1')

# 新增区域2,区域2嵌套在区域1内
left,botton,width,height=0.2,0.6,0.25,0.25
ax2=fig.add_axes([left,botton,width,height])
ax2.plot(x,y,'b')
ax2.set_title('area2')
plt.show()
绘制空白的三维图形
# 绘制空白的三维图形
import matplotlib.pyplot as plt

fig=plt.figure()
ax=fig.add_subplot(111,projection='3d')
# 添加信息
plt.xlabel('x')
plt.ylabel('y')
plt.title('A blank 3D anxis')
# 保存
# plt.savefig(path,dpi=500)

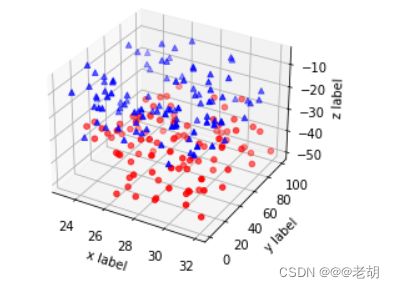
散点图绘制
散点图的绘制主要用到 ax.scatter(xs,ys,zs,s=20,c=None,depthshade=True,*args,*kwargs)
- xs,ys,zs:表示输入数据
- s:scatter点的尺寸
- c:颜色,比如 c=‘r’ 表示红色
- depthshase:透明化,True表示透明,默认为True
- *args为扩展变量,如maker=‘o’,则scatter的结果为 o 形状
import matplotlib.pyplot as plt
import numpy as np

def randrange(n,vmin,vmax):
    return (vmax-vmin)*np.random.rand(n)+vmin

fig=plt.figure()
ax=fig.add_subplot(111,projection='3d')

n=100
# for c,m,zlow,zhigh in [('r','o',-50,-25)]:
for c,m,zlow,zhigh in [('r','o',-50,-25),('b','^',-30,-5)]:
    xs=randrange(n,23,32)
    ys=randrange(n,1,100)
    zs=randrange(n,zlow,zhigh)
    ax.scatter(xs,ys,zs,c=c,marker=m)

ax.set_xlabel('x label')
ax.set_ylabel('y label')
ax.set_zlabel('z label')

plt.show()
线框图
ax.plot_wireframe(x,y,z,*args,**kwargs)
- x,y,z:输入数据
- rstride:行步长
- cstride:列步长
- rcount:行数上限
- ccount:列数上限
import matplotlib.pyplot as plt
from mpl_toolkits.mplot3d import axes3d
fig=plt.figure()
ax=fig.add_subplot(111,projection='3d')
x,y,z=axes3d.get_test_data(0.05)
ax.plot_wireframe(x,y,z,rstride=10,cstride=10)
plt.show()

表面图
ax.plot_surface(x,y,z,*args,**kwargs)
- x,y,z:数据
- color:颜色
- cmap:图层
import matplotlib.pyplot as plt
from matplotlib import cm
from matplotlib.ticker import LinearLocator,FormatStrFormatter
import numpy as np

fig=plt.figure()
ax=fig.gca(projection='3d')

x=np.arange(-5,5,0.25)
y=np.arange(-5,5,0.25)
x,y=np.meshgrid(x,y)
r=np.sqrt(x**2+y**2)
z=np.sin(r)

surf=ax.plot_surface(x,y,z,cmap=cm.coolwarm,linewidth=0,antialiased=False)

ax.set_zlim(-1.01,1.01)
ax.zaxis.set_major_locator(LinearLocator(10))
ax.zaxis.set_major_formatter(FormatStrFormatter('%.02f'))

fig.colorbar(surf,shrink=0.5,aspect=5)

plt.show()

点击参考链接