链路延迟探测模块介绍
模块框图:
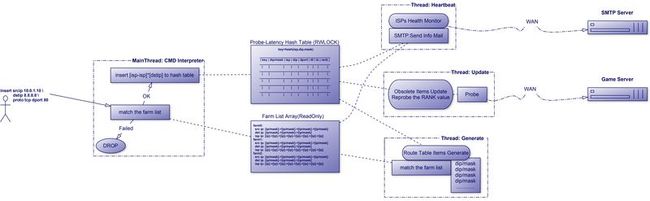
功能介绍:(部分参考于Radware的LinkProof产品中,产品文档1,产品文档2)
动态链路最优检测模块

匹配组(farms)
就近网络段命中(例如当proximity为24时,如已经探测了8.8.8.8/24,接下来dip为8.8.8.0/24范围内的直接命中,直到此条目老化)
广域网络链路复杂 采用多种延迟检测方案(udp icmp tcp-half-open remotest-host等四种)
条目老化与更新
命令行cmd交互程序
    insert proto [Tt][Cc][Pp]|[Uu][Dd][Pp] \
        dip {ip} \
        sip {ip} \
        isp {ip} \
        dport [0-9]+ \
        ts [0-9]+ \
        latency [0-9]+
    dump all|head|gen|farm|conf
    debug //切换至debug模式 更多的debug日志输出
配置文件解析(pcre)
日志滚动
健康监测 失效报警
灾难日志checkpoint恢复
模块配置文件示例:
[main]
retries=2        // probe retry if fail
whiteport=53     // if dport is whiteport,do not probe
rechecktime=120  // probe result timeout
timeout=400      // packet max delay could tolerate
subnetmask=255.255.255.0 // proximity
subnetcount=100000 // max hash table items
pingcounts=10 // averaging
logdir=/var/log/

[isp]  // lines choosable
isp1=1.1.1.1                 #pccw
isp2=1.1.1.2                 #hkct
isp3=1.1.1.3                 #us01
isp4=1.1.1.5                 #us03
isp5=1.1.1.5                 #gzct
isp100=1.1.1.6

[farm1]
srcip=10.96.24.0/24,10.96.25.0/24
dstip=8.8.8.0/24,8.8.4.0/24
isps=isp1,isp2,isp3,isp4,isp5
[farm10]
srcip=10.96.80.0/24,10.80.25.0/24
dstip=8.8.8.0/24,8.8.4.0/24
isps=isp6,isp7,isp2,isp100

/*
from 10.96.80.0/24 to 8.8.8.0/24 via isp6
from 10.80.25.0/24 to 8.8.8.0/24 via isp6
from 10.96.80.0/24 to 8.8.4.0/24 via isp7
from 10.80.25.0/24 to 8.8.4.0/24 via isp7
*/

[health monitor]
healthcheck_type=ping/telnet
healthcheck_pingtarget=8.8.8.8
healthcheck_pingcounts=10
healthcheck_telnettarget=www.g.cn
healthcheck_retries=2
healthcheck_interval=300

[warning]
smtpserver=xx.com
smtpserver_backup=xy..com
username=
password=
port=
mailto="[email protected]","[email protected]"
探测方法:
1.udp
The traditional, ancient method of tracerouting. Used by default.
Probe packets are udp datagrams with so-called "unlikely" destination ports. The "unlikely" port of the first probe is 33434, then for each next probe it is incremented by one. Since the ports are expected to be unused, the destination host normally returns "icmp unreach port" as a final response. (Nobody knows what happens when some application listens for such ports, though).
发送udp至很大的udp-port 期望得到"icmp unreach port"报文回复
$ traceroute -M udp -p 2000 www.baidu.com -n -w 1 -q 1 -m 20 | ix

$ traceroute -M udp -p 2000 www.baidu.com -f 12 -m 12 -n -w 1 -q 10 | ix
2.icmp
Most usual method for now, which uses icmp echo packets for probes.
If you can ping(8) the destination host, icmp tracerouting is applicable as well.
icmp探测
$ traceroute -M icmp 8.8.8.8 -n -w 1 -q 1 -m 20 | ix

$ traceroute -M icmp 8.8.8.8 -f 8 -m 8 -n -w 1 -q 10 | ix
3.tcp
tcp half open to bypass firewall,如果对方tcp服务已开启,这种方式能有效地穿透防火墙
$ traceroute -M tcp -p 443 www.baidu.com -n -w 1 -q 1 -m 20 | ix

$ traceroute -M tcp -p 443 www.baidu.com -f 14 -m 14 -n -w 1 -q 10 | ix
4.remotest ping
以上三种方法均失效 将使用udp方式选择出最远的一跳 对其进行测试延迟
$ traceroute -M udp -p 2000 www.baidu.com -n -w 1 -q 1 -m 20 | ix
$ traceroute -M udp -p 2000 www.baidu.com -f 12 -m 12 -n -w 1 -q 10 | ix
