普罗米修斯监控系统搭建并整合_golang实时监控服务
当我们部署了服务器后,我们可能需要对我们的服务器进行监控,因此需要一套监控系统帮我们完成这个工作,我们需要监控的维度有:
机器维度:物理机的CPU使用情况、内存使用情况、磁盘使用情况等;
接口维度:接口调用次数、响应时长、成功率等。
下面开始介绍如何使用Prometheus和Grafana监控这些指标。
**配置Prometheus
- 安装Prometheus采集器**
采集器有多种类型,比如采集系统数据,采集nginx数据,采集mysql数据等等。可以根据需要在目标主机上安装需要的采集器。可以根据自己的需要安装一个或多个。这里只安装机器系统数据采集器。
通过下述命令拉取Prometheus系统采集器镜像
docker pull prom/node-exporter
以docker形式启动
docker run -d -p 9100:9100 -v "/proc:/host/proc:ro" -v "/sys:/host/sys:ro" -v "/:/rootfs:ro" prom/node-exporter
2. 安装Prometheus
通过下述命令拉取Prometheus镜像
docker pull prom/prometheus
创建prometheus配置文件。
mkdir /opt/prometheus
cd /opt/prometheus/
vim /opt/prometheus/prometheus.yml
编辑配置文件
global:
  # 采集周期
  scrape_interval:     10s
  external_labels:
    monitor: 'codelab-monitor'

scrape_configs:
  # prometheus 自身监控
  - job_name: 'prometheus'
    static_configs:
      - targets: ['localhost:9100'] #需要监控的地址,这里填的是上面启动的Prometheus采集器的地址

  # node_exporter 监控数据采集
  - job_name: 'node'
    static_configs:
      - targets:
          - "127.0.0.1:18063"  #需要监控的地址(云服务器项目请求入口)
    relabel_configs:
      - source_labels: [__address__]
        regex: (.+):[0-9]+
        target_label: host
启动prometheus
docker run -d -p 9090:9090 --net=host -v /opt/prometheus/prometheus.yml:/etc/prometheus/prometheus.yml prom/prometheus
接下来打开http://localhost:9090
选择Status->Targets
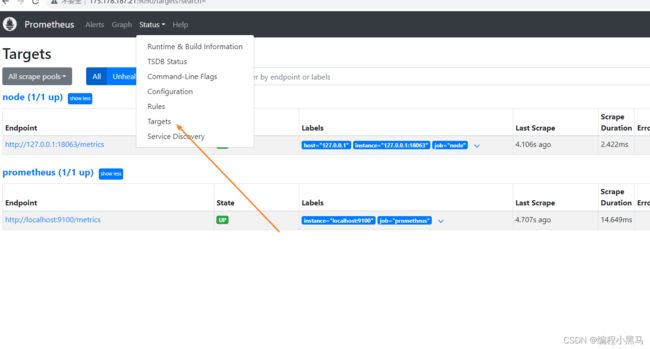
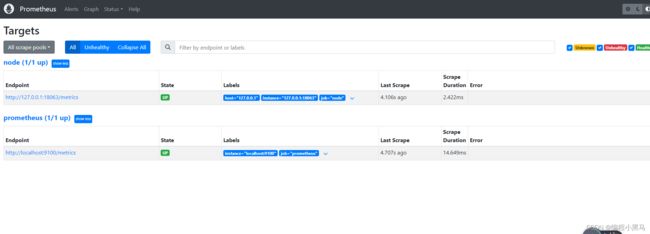
安装grafana
拉取grafana镜像。
docker pull grafana/grafana
准备本地保存数据的目录。
mkdir /opt/grafana-storage
chmod 777 -R /opt/grafana-storage
启动grafana
docker run -d -p 3000:3000 --name=grafana --net=host -v /opt/grafana-storage:/var/lib/grafana grafana/grafana
接下来打开 http://localhost:3000
输入用户名 admin 密码 admin
首先为grafana配置prometheus数据源。

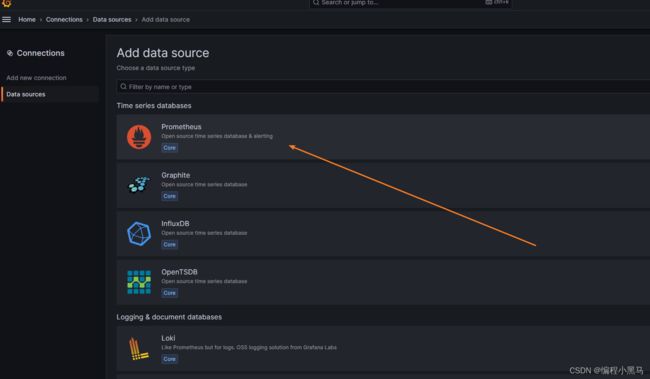
填入promethus的地址
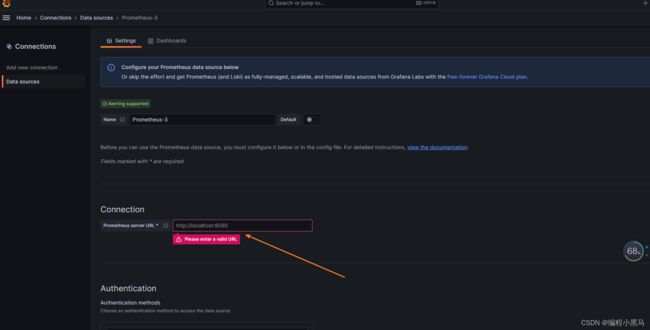
确定创建

配置prometheus数据源后,可以开始使用了。
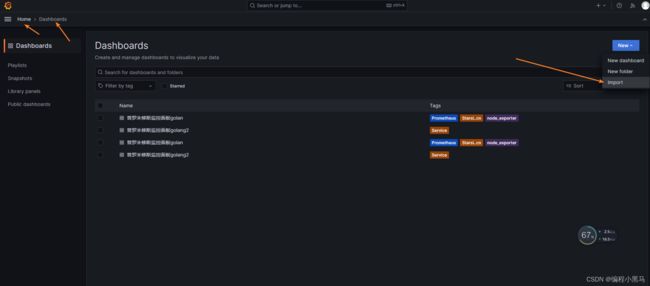
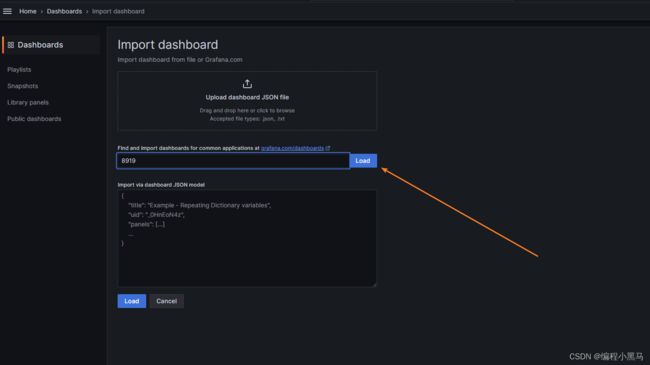
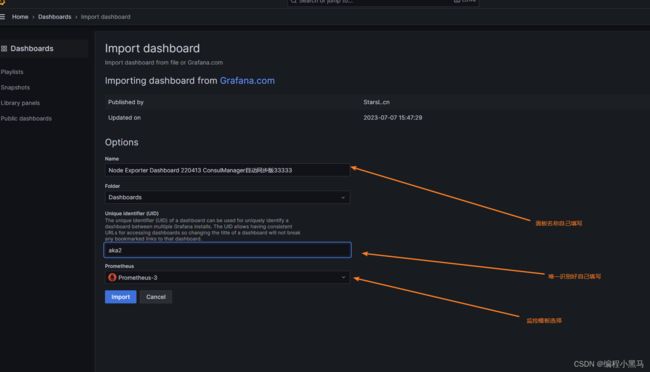
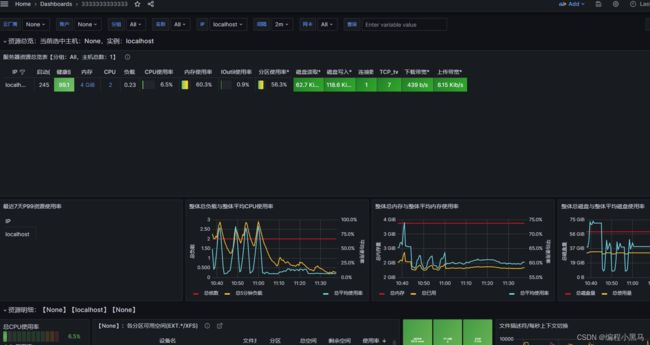
这里可以使用中文的监控模板8919,视觉效果十分好。
填入【8919】后点击右侧的【Load】
收集Go程序指标
如果我们想按照接口来进行监控,该怎么收集、上报和展示这些数据呢?比如我们有一个http server,开放了数个POST/GET接口,我们需要对这些接口进行监控,我们关心的监控指标包括:
调用次数(每秒/每分钟/每小时/每天)
请求的响应时间
接下来将以Gin server为例,使用prometheus来监控这些指标,并通过grafana来直观展示这些数据。
我们开放了GET接口:/get_result,此时我们需要对该接口进行监控,我们使用了ginprom来进行中间件进行处理。
package main

import (
	"github.com/gin-gonic/gin"
	"github.com/prometheus/client_golang/prometheus/promhttp"
	"github.com/chenjiandongx/ginprom"
    "net/http"
	"math/rand"
)


func get_result(c *gin.Context) {


	if rand.Intn(10) < 1 {

		c.JSON(http.StatusInternalServerError, "server inner error")
	} else {

		c.JSON(http.StatusOK, "OK")
	}
}

func query_result(c *gin.Context) {


	if rand.Intn(10) < 2 {

		c.JSON(http.StatusInternalServerError, "server inner error")
	} else {

		c.JSON(http.StatusOK, "OK")
	}
}

func main() {


	r := gin.Default()

	r.Use(ginprom.PromMiddleware(nil))

	r.GET("/get_result", get_result)
	r.GET("/query_result", query_result)

	r.GET("/metrics", ginprom.PromHandler(promhttp.Handler()))

	r.Run(":7777")

}
此时只要是访问我们gin server的请求,都会走PromMiddleware,完成数据收集,同时开放的/metrics是供promethus调用的。在/opt/prometheus/prometheus.yml 这里配置。配置好这个收集器后,prometheus会按照约定的采集频率调用/metrics接口获取数据。
# node_exporter 监控数据采集
  - job_name: 'node'
    static_configs:
      - targets:
          - "127.0.0.1:18063"  #需要监控的地址
当server进程启动后,我们可以使用ganfana来展示我们的实时QPS数据。
如果我们觉得面板太多看不到重要的指标,可以使用下面的模板

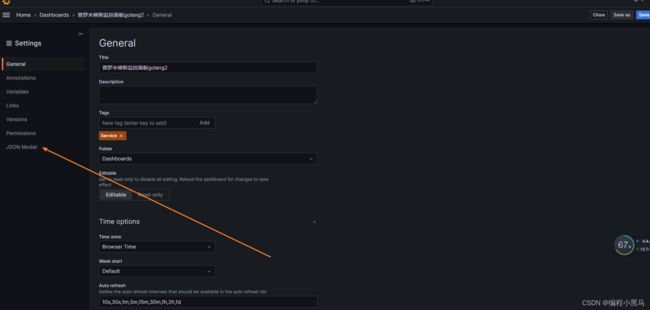
替换掉json文件模型
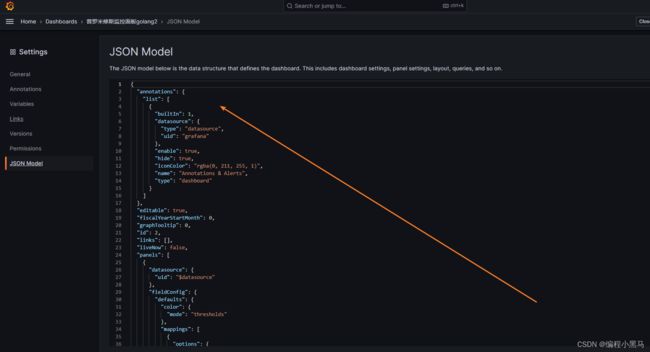
https://github.com/chenjiandongx/ginprom/blob/master/ginprom-service.json
{

  "annotations": {

    "list": [
      {

        "builtIn": 1,
        "datasource": "-- Grafana --",
        "enable": true,
        "hide": true,
        "iconColor": "rgba(0, 211, 255, 1)",
        "name": "Annotations & Alerts",
        "type": "dashboard"
      }
    ]
  },
  "editable": true,
  "gnetId": null,
  "graphTooltip": 0,
  "id": 242,
  "iteration": 1608172494931,
  "links": [],
  "panels": [
    {

      "cacheTimeout": null,
      "colorBackground": false,
      "colorValue": true,
      "colors": [
        "#5794F2",
        "#5794F2",
        "#5794F2"
      ],
      "datasource": "$datasource",
      "format": "dateTimeAsUS",
      "gauge": {

        "maxValue": 100,
        "minValue": 0,
        "show": false,
        "thresholdLabels": false,
        "thresholdMarkers": true
      },
      "gridPos": {

        "h": 6,
        "w": 6,
        "x": 0,
        "y": 0
      },
      "id": 14,
      "interval": null,
      "links": [],
      "mappingType": 1,
      "mappingTypes": [
        {

          "name": "value to text",
          "value": 1
        },
        {

          "name": "range to text",
          "value": 2
        }
      ],
      "maxDataPoints": 100,
      "nullPointMode": "connected",
      "nullText": null,
      "postfix": "",
      "postfixFontSize": "50%",
      "prefix": "",
      "prefixFontSize": "50%",
      "rangeMaps": [
        {

          "from": "null",
          "text": "N/A",
          "to": "null"
        }
      ],
      "sparkline": {

        "fillColor": "rgba(31, 118, 189, 0.18)",
        "full": false,
        "lineColor": "rgb(31, 120, 193)",
        "show": false
      },
      "tableColumn": "",
      "targets": [
        {

          "expr": "(time() - service_uptime{job=~\"$job\"}) * 1000",
          "format": "time_series",
          "intervalFactor": 1,
          "refId": "A"
        }
      ],
      "thresholds": "",
      "timeFrom": null,
      "timeShift": null,
      "title": "Service last updated",
      "type": "singlestat",
      "valueFontSize": "110%",
      "valueMaps": [
        {

          "op": "=",
          "text": "N/A",
          "value": "null"
        }
