ECharts入门
一、简介
ECharts是一个来自百度的开源的javascript图标库。通过ECharts我们可以呈现出多种类型的图表。ECharts底层基于ZRender(一个全新的轻量级canvas类库),创建了坐标系,图例,提示,工具箱等基础组件,并在此上构建出折线图、柱状图、散点图、K线图、饼图、雷达图、地图、和弦图、力导向布局图、仪表盘以及漏斗图,同时支持任意维度的堆积和多图表混合展现。
ECharts 下载地址为:http://echarts.baidu.com/index.html 。
使用如下:
1、下载Echarts,示例版本为echarts-2.2.1,下载之后解压。目录结构如下:

doc目录下的是相关文档。extension是进行扩展的示例。src目录下是源码文件。test目录下是相关测试。build目录下有dist与source目录。使用的echarts只需要dist目录下的所有文件。将dist目录下的文件拷贝到我们的工作目录echarts中。
2、在网页中引入如下js即可使用。
<script src="js/jquery-1.10.2.min.js"></script>

<script src="echarts/echarts-all.js"></script>
二、示例
  1 <!DOCTYPE html>

  2 <html lang="en">

  3 <head>

  4     <meta charset="utf-8">

  5     <meta name="description" content="ECharts">

  6     <title>地图示例</title>

  7 </head>

  8 <body>

  9     <div   id="map"  style="height: 400px; width:500px" ></div>

 10 <script src="jquery.min.js"></script>

 11 <script src="echarts-all.js"></script>

 12 <script type="text/javascript">

 13 var map = echarts.init(document.getElementById('map'));

 14 $(function(){

 15     var option = {

 16         title : {

 17             text: '年度异常统计地区图',//标题

 18             x:'center'//位置

 19         },

 20         tooltip : {

 21             trigger: 'item'

 22         },

 23         legend: {

 24             orient: 'vertical',//位置水平或垂直

 25             x:'left',//位置,left、center、right

 26             data:['统计值']

 27         },

 28         dataRange: {//数据区间

 29             min: 0,//最小值

 30             max: 1000,//最大值

 31             x: 'left',//位置

 32             y: 'bottom',//位置

 33             //show:false,//是否可见

 34             orient:'horizontal',//位置水平或垂直

 35             text:['高','低'],

 36             color : ['#1e90ff','#f0ffff'],  // 颜色

 37             calculable : true

 38         },

 39        /* toolbox: {

 40             show: true,

 41             orient : 'vertical',

 42             x: 'right',

 43             y: 'center',

 44             feature : {

 45                 mark : {show: true},

 46                 dataView : {show: true, readOnly: false},

 47                 restore : {show: true},

 48                 saveAsImage : {show: true}

 49             }

 50         },*/

 51         series : [

 52             {

 53                 name: '统计值',

 54                 type: 'map',//图表类型

 55                 mapType: 'china',//地图类型

 56                 roam: false,

 57                 itemStyle:{

 58                     normal:{

 59                         label:{show:true},

 60                         areaStyle:{color:'red'}

 61                     },

 62                     emphasis:{label:{show:true}}

 63                 },

 64                 data:[//数值

 65                     {name: '北京',value: Math.round(Math.random()*1000)},

 66                     {name: '天津',value: Math.round(Math.random()*1000)},

 67                     {name: '上海',value: Math.round(Math.random()*1000)},

 68                     {name: '重庆',value: Math.round(Math.random()*1000)},

 69                     {name: '河北',value: Math.round(Math.random()*1000)},

 70                     {name: '河南',value: Math.round(Math.random()*1000)},

 71                     {name: '云南',value: Math.round(Math.random()*1000)},

 72                     {name: '辽宁',value: Math.round(Math.random()*1000)},

 73                     {name: '黑龙江',value: Math.round(Math.random()*1000)},

 74                     {name: '湖南',value: Math.round(Math.random()*1000)},

 75                     {name: '安徽',value: Math.round(Math.random()*1000)},

 76                     {name: '山东',value: Math.round(Math.random()*1000)},

 77                     {name: '新疆',value: Math.round(Math.random()*1000)},

 78                     {name: '江苏',value: Math.round(Math.random()*1000)},

 79                     {name: '浙江',value: Math.round(Math.random()*1000)},

 80                     {name: '江西',value: Math.round(Math.random()*1000)},

 81                     {name: '湖北',value: Math.round(Math.random()*1000)},

 82                     {name: '广西',value: Math.round(Math.random()*1000)},

 83                     {name: '甘肃',value: Math.round(Math.random()*1000)},

 84                     {name: '山西',value: Math.round(Math.random()*1000)},

 85                     {name: '内蒙古',value: Math.round(Math.random()*1000)},

 86                     {name: '陕西',value: Math.round(Math.random()*1000)},

 87                     {name: '吉林',value: Math.round(Math.random()*1000)},

 88                     {name: '福建',value: Math.round(Math.random()*1000)},

 89                     {name: '贵州',value: Math.round(Math.random()*1000)},

 90                     {name: '广东',value: Math.round(Math.random()*1000)},

 91                     {name: '青海',value: Math.round(Math.random()*1000)},

 92                     {name: '西藏',value: Math.round(Math.random()*1000)},

 93                     {name: '四川',value: Math.round(Math.random()*1000)},

 94                     {name: '宁夏',value: Math.round(Math.random()*1000)},

 95                     {name: '海南',value: Math.round(Math.random()*1000)},

 96                     {name: '台湾',value: Math.round(Math.random()*1000)},

 97                     {name: '香港',value: Math.round(Math.random()*1000)},

 98                     {name: '澳门',value: Math.round(Math.random()*1000)}

 99                 ]

100             }

101         ]

102     };

103     map.setOption(option);

104

105     map.on("click", function(event){//点击事件

106         alert(event.name + event.value);

107         console.log(event);

108     });

109 });

110 </script>

111 </body>

112 </html>
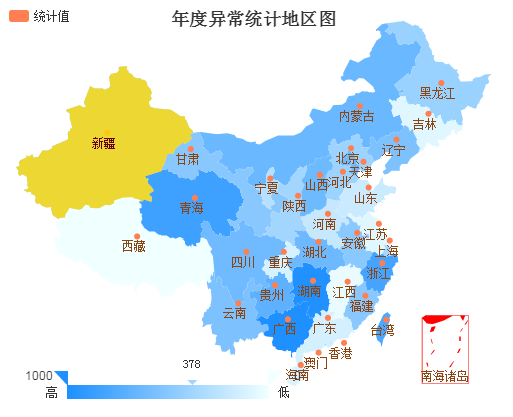
效果如下:
