React使用@antv/g6绘制树形图
在react中通过@antv/g6实现树形图,包括自定义连接线、弹窗、展开/收起、配置项说明
1、自定义连接线
const flowLine = {
  draw(cfg: any, group: any) {
    const startPoint = cfg.startPoint;
    const endPoint = cfg.endPoint;
    const sourceModel = cfg?.sourceNode?._cfg?.model;
    const targetModel = cfg?.targetNode?._cfg?.model;
    const path = [
          ['M', startPoint.x, startPoint.y - 20],
          ['L', startPoint.x, (startPoint.y + endPoint.y) / 2 + 8],
          ['L', endPoint.x, (startPoint.y + endPoint.y) / 2 + 8],
          ['L', endPoint.x, endPoint.y],
        ];

    const sourceSelected = sourceModel?.isAbnormal;
    const targetSelected = targetModel?.isAbnormal;
    const isSelected = !!sourceModel?.parentMetricNodeId
      ? targetSelected && sourceSelected
      : targetSelected;

    const shape = group.addShape('path', {
      attrs: {
        stroke: isSelected ? 'red' : '#cacaca',
        path,
      },
    });
    return shape;
  },
}
2、自定义树形图节点
import React from 'react';
import { Rect, Text, Group } from '@antv/g6-react-node';
import { nullIf, toFixed, toPercentage } from '@/utils/tools';

interface Props {
  cfg: any;
}
export default function ParentChild({ cfg }: Props) {
  const { name, value, cycleValueDiff = 0, onClick } = cfg;

  return (


            {nullIf(name)}


            {nullIf(value ? parseFloat(value) : null, { render: toFixed })}


          {`环比:`}

            {nullIf(cycleValueDiff, { render: toPercentage })?.toString()}


  );
}
3、定义样式和layout配置
const defaultStateStyles = {
  hover: {
    stroke: '#1890ff',
    lineWidth: 2,
  },
};

const defaultLayout = {
  type: 'compactBox',
  direction: 'TB',
  getId: function getId(d: any) {
    return d.id;
  },
  getHeight: function getHeight() {
    return 196;
  },
  getWidth: function getWidth() {
    return 280;
  },
  getVGap: function getVGap() {
    return 8;
  },
  getHGap: function getHGap() {
    return 24;
  },
};
4、自定义tooltip
const tooltip = new G6.Tooltip({
  fixToNode: [0, 0],
  offsetX: 42,
  offsetY: -16,
  className: 'g6-tooltip',
  itemTypes: ['node'],
  shouldBegin: (e: any) => {
    return !!e?.item?._cfg?.model?.description;
  },
  getContent(e: any) {
    const model = e?.item?.getModel();
    return `${model?.name}${model?.description || ''}`;
  },
});
5、TreeGraph的一些配置和说明
function getTreeGraphConfig({ width, height }: any) {
  return {
    container: 'container',
    width,
    height,
    linkCenter: true,
    // fitCenter: true,
    fitView: true,
    preventOverlap: true,
    plugins: [tooltip],
    modes: {
      default: [
        {
          type: 'collapse-expand',
          trigger: 'click',
          onChange: function onChange(item: any, collapsed: any) {
            const cur = item.get('model');
            cur.collapsed = collapsed;
            return true;
          },
          shouldBegin: (e: any) => {
            // 若当前操作的节点 type 不为 'marker',则不发生 collapse-expand
            if (e?.target?.get('type') != 'marker') return false;
            return true;
          },
        },
        // 开启选中之后高亮相邻
        // {
        //   type: 'activate-relations',
        //   resetSelected: true
        // },
        // 开启之后画布滚动
        // {
        //   type: 'scroll-canvas',
        //   zoomKey: 'ctrl'
        // },
        // 缩放
        // 'zoom-canvas',
        // 拖拽
        // 'drag-canvas',
        // 'scroll-canvas',
        // 'drag-node',
      ],
    },
    // renderer: "svg",
    defaultNode: {
      type: 'node-child',
      size: [280, 156],
    },
    defaultEdge: {
      type: 'flow-line',
    },
    nodeStateStyles: defaultStateStyles,
    edgeStateStyles: defaultStateStyles,
    layout: defaultLayout,
  };
}
6、在React组件中使用
const graphRef = useRef();
useEffect(() => {
G6.registerNode('node-child', createNodeFromReact( 7、最终效果
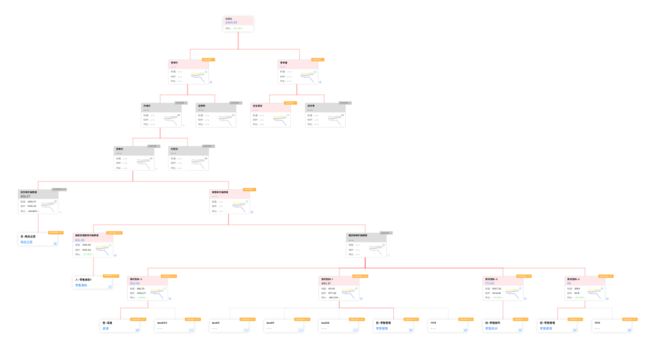
参考:
[官网:@antv/g6]
[官网:React中使用@antv/g6]
[官网:使用dom自定义节点]
[官网:React中自定义节点]
G6 的节点/边事件不支持 DOM 类型的图形。如果需要为 DOM 节点绑定事件,请使用原生 DOM 事件