Echarts 环形图 自定义配置
业务需求实现一个圆环图,看着简单,做起来卡卡的……
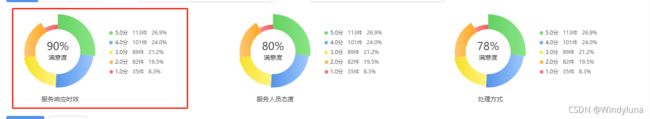
效果图:
步骤:
1、从echarts官网上复制一个最基本的饼图
2、在series中设置饼图的半径 和 饼图的中心(圆心)坐标 形成圆环

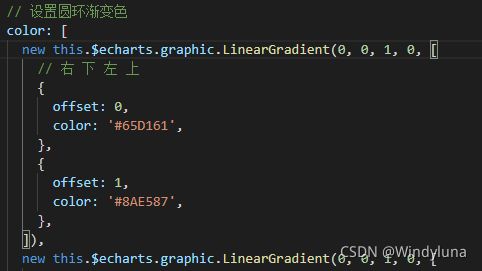
3、设置圆环渐变色 color 、线性渐变
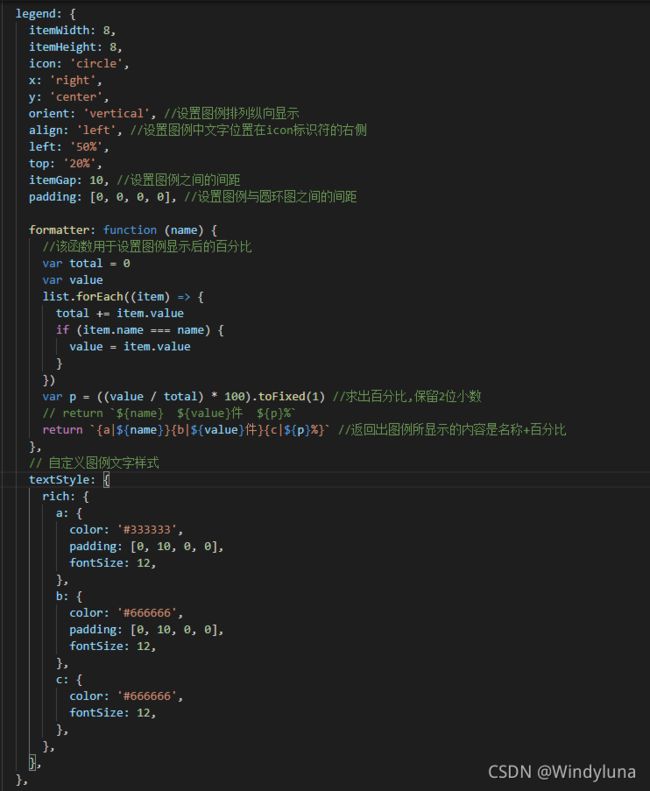
4、图例说明与图表呈横向排列,设置:legend
细节点:
(1)图例的图标改为圆形
(2)图例的图标在左,文字在右
(3)右边图例与圆环图位置水平居中
(4)自定义图例文字样式,文字之间有间隔,文字颜色尺寸等,使用 rich

实现:
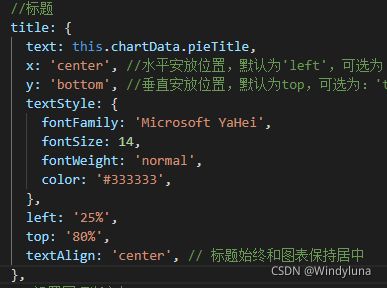
5、图表的标题始终与圆环图保持居中
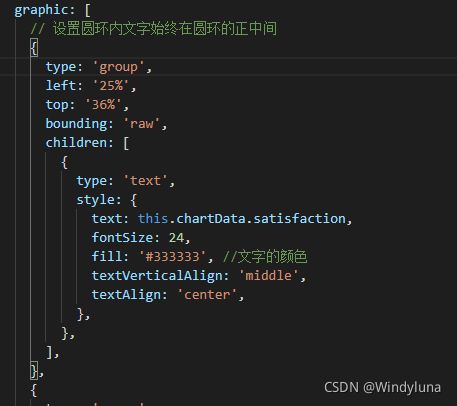
6、设置圆环内文字始终在圆环的正中间,并且自适应
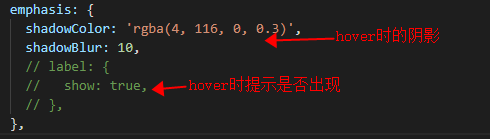
7、设置hover圆环时有阴影:series 的 emphasis 属性
完整实现:
组件:
<template>
  <div ref="treeChartCommon" :style="{ height: '242px' }">div>
template>

<script>
export default {
  name: 'eCharts',
  props: {
    chartData: {
      type: Object,
      required: false,
    },
  },
  data() {
    return {
      pieData: [],
    }
  },
  mounted() {
    this.showChart()
  },
  methods: {
    showChart() {
      // 基于准备好的dom,初始化echarts实例
      var myChart = this.$echarts.init(this.$refs.treeChartCommon)
      myChart.clear()

      this.pieData = this.chartData.pieData
      const list = this.pieData

      // 指定图表的配置项和数据
      var option = {
        //标题
        title: {
          text: this.chartData.pieTitle,
          x: 'center', //水平安放位置,默认为'left',可选为:'center' | 'left' | 'right' | {number}(x坐标,单位px)
          y: 'bottom', //垂直安放位置,默认为top,可选为:'top' | 'bottom' | 'center' | {number}(y坐标,单位px)
          textStyle: {
            fontFamily: 'Microsoft YaHei',
            fontSize: 14,
            fontWeight: 'normal',
            color: '#333333',
          },
          left: '25%',
          top: '80%',
          textAlign: 'center', // 标题始终和图表保持居中
        },
        // 设置圆环渐变色
        color: [
          new this.$echarts.graphic.LinearGradient(0, 0, 1, 0, [
            // 右 下 左 上
            {
              offset: 0,
              color: '#65D161',
            },
            {
              offset: 1,
              color: '#8AE587',
            },
          ]),
          new this.$echarts.graphic.LinearGradient(0, 0, 1, 0, [
            {
              offset: 0,
              color: '#5393E7',
            },
            {
              offset: 1,
              color: '#9EC8FF',
            },
          ]),
          new this.$echarts.graphic.LinearGradient(0, 0, 1, 0, [
            //0, 1, 1, 0
            {
              offset: 0,
              color: '#F5E127',
            },
            {
              offset: 1,
              color: '#FFF381',
            },
          ]),
          new this.$echarts.graphic.LinearGradient(0, 0, 1, 0, [
            {
              offset: 0,
              color: '#FFC772',
            },
            {
              offset: 1,
              color: '#FFA51E',
            },
          ]),
          new this.$echarts.graphic.LinearGradient(0, 0, 1, 0, [
            {
              offset: 0,
              color: '#FF8A8A',
            },
            {
              offset: 1,
              color: '#EC6161',
            },
          ]),
        ],

        legend: {
          itemWidth: 8,
          itemHeight: 8,
          icon: 'circle',
          x: 'right',
          y: 'center',
          orient: 'vertical', //设置图例排列纵向显示
          align: 'left', //设置图例中文字位置在icon标识符的右侧
          left: '50%',
          top: '20%',
          itemGap: 10, //设置图例之间的间距
          padding: [0, 0, 0, 0], //设置图例与圆环图之间的间距

          formatter: function (name) {
            //该函数用于设置图例显示后的百分比
            var total = 0
            var value
            list.forEach((item) => {
              total += item.value
              if (item.name === name) {
                value = item.value
              }
            })
            var p = ((value / total) * 100).toFixed(1) //求出百分比,保留2位小数
            // return `${name}  ${value}件  ${p}%`
            return `{a|${name}}{b|${value}件}{c|${p}%}` //返回出图例所显示的内容是名称+百分比
          },
          // 自定义图例文字样式
          textStyle: {
            rich: {
              a: {
                color: '#333333',
                padding: [0, 10, 0, 0],
                fontSize: 12,
              },
              b: {
                color: '#666666',
                padding: [0, 10, 0, 0],
                fontSize: 12,
              },
              c: {
                color: '#666666',
                fontSize: 12,
              },
            },
          },
        },
        graphic: [
          // 设置圆环内文字始终在圆环的正中间
          {
            type: 'group',
            left: '25%',
            top: '36%',
            bounding: 'raw',
            children: [
              {
                type: 'text',
                style: {
                  text: this.chartData.satisfaction,
                  fontSize: 24,
                  fill: '#333333', //文字的颜色
                  textVerticalAlign: 'middle',
                  textAlign: 'center',
                },
              },
            ],
          },
          {
            type: 'group',
            left: '25%',
            top: '46%',
            bounding: 'raw',
            children: [
              {
                type: 'text',
                style: {
                  text: '满意度',
                  fontSize: 14,
                  fill: '#333333', //文字的颜色
                  textVerticalAlign: 'middle',
                  textAlign: 'center',
                },
              },
            ],
          },
        ],
        calculable: true,
        series: [
          {
            name: '企业类型',
            type: 'pie',
            radius: ['42%', '70%'], //饼图的半径,数组的第一项是内半径,第二项是外半径。支持设置成百分比,相对于容器高宽中较小的一项的一半。可以将内半径设大显示成圆环图, 设置内半径和外半径,形成环状
            center: ['25%', '40%'], //饼图的中心(圆心)坐标,数组的第一项是横坐标,第二项是纵坐标。支持设置成百分比,设置成百分比时第一项是相对于容器宽度,第二项是相对于容器高度。这里的center一旦设置, 则 graphic/legend 里的内容位置也要相应进行调整
            roseType: 'radius',
            itemStyle: {
              normal: {
                label: {
                  show: false,
                },
                labelLine: {
                  show: true,
                },
              },
              emphasis: {
                shadowColor: 'rgba(4, 116, 0, 0.3)',
                shadowBlur: 10,
                // label: {
                //   show: true,
                // },
              },
            },
            data: this.pieData,
          },
        ],
      }
      // 使用刚指定的配置项和数据显示图表。
      myChart.setOption(option)

      window.addEventListener('resize', function () {
        //浏览器大小调整echarts随之改变
        myChart.resize()
      })
    },
  },
}
script>
页面中调用组件:
<template>
  <el-row :gutter="20">
    <el-col :span="8">
      <DoughnutChart :chartData="chartData_1" />
    el-col>
    <el-col :span="8">
      <DoughnutChart :chartData="chartData_2" />
    el-col>
    <el-col :span="8">
      <DoughnutChart :chartData="chartData_3" />
    el-col>
  el-row>
template>

<script>
import DoughnutChart from './components/doughnutChart.vue'
export default {
  components: {
    DoughnutChart,
  },
  data() {
    return {
      chartData_1: {},
      chartData_2: {},
      chartData_3: {},
    }
  },
  created() {
    this.chartData_1 = {
      pieData: [
        {
          value: 113,
          name: '5.0分',
        },
        {
          value: 101,
          name: '4.0分',
        },
        {
          value: 89,
          name: '3.0分',
        },
        {
          value: 82,
          name: '2.0分',
        },
        {
          value: 35,
          name: '1.0分',
        },
      ],
      pieTitle: '服务响应时效',
      satisfaction: '90%',
    }
    this.chartData_2 = {
      pieData: [
        {
          value: 113,
          name: '5.0分',
        },
        {
          value: 101,
          name: '4.0分',
        },
        {
          value: 89,
          name: '3.0分',
        },
        {
          value: 82,
          name: '2.0分',
        },
        {
          value: 35,
          name: '1.0分',
        },
      ],
      pieTitle: '服务人员态度',
      satisfaction: '80%',
    }
    this.chartData_3 = {
      pieData: [
        {
          value: 113,
          name: '5.0分',
        },
        {
          value: 101,
          name: '4.0分',
        },
        {
          value: 89,
          name: '3.0分',
        },
        {
          value: 82,
          name: '2.0分',
        },
        {
          value: 35,
          name: '1.0分',
        },
      ],
      pieTitle: '处理方式',
      satisfaction: '78%',
    }
  },
}
script>

<style lang="scss" scoped>
style>