Matlab语言下A*算法的改进--表格形式导入环境地图&输出路径索引值
本篇文章基于上篇文章进行改进,上篇文章链接如下:
Matlab语言下对A*算法的研究--实现任意两点之间的路径规划
改进一:以.xlsx表格形式导入环境地图到matlab程序中
主要代码如下:
field = readmatrix('map.xlsx');
map.xlsx如下:
说明:以表格形式导入环境地图的好处是能够灵活动态地根据需求变换地图,不需要麻烦去程序里更改地图。
改进二:以索引值形式输出最优路径
主要代码如下:
第一处变动是在调用findWayBack函数进行路径回溯时,增加以下语句:
disp(path_index(end:-1:1)); %打印输出路径的索引值
第二处变动是对于findWayBack函数的更改,代码如下:
function [path, path_index] = findWayBack(goalposind, fieldpointers)
    [n, m] = size(fieldpointers);
    posind = goalposind;
    [py, px] = ind2sub([n, m], posind);   %将索引值posind转换为坐标值[py,px]
    path = [py px];
    path_index = posind;

    %利用while循环进行回溯,当我们回溯到起始点的时候停止,也就是在矩阵fieldpointers中找到S时停止
    while ~strcmp(fieldpointers{posind},'S')
      switch fieldpointers{posind}

        case 'L' % ’L’ 表示当前的点是由左边的点拓展出来的
          px = px - 1;
        case 'R' % ’R’ 表示当前的点是由右边的点拓展出来的
          px = px + 1;
        case 'U' % ’U’ 表示当前的点是由上面的点拓展出来的
          py = py - 1;
        case 'D' % ’D’ 表示当前的点是由下边的点拓展出来的
          py = py + 1;
      end
      path = [path; py px];
      posind = sub2ind([n m], py, px);  %将坐标值转换为索引值
      path_index = [path_index, posind];
    end
end
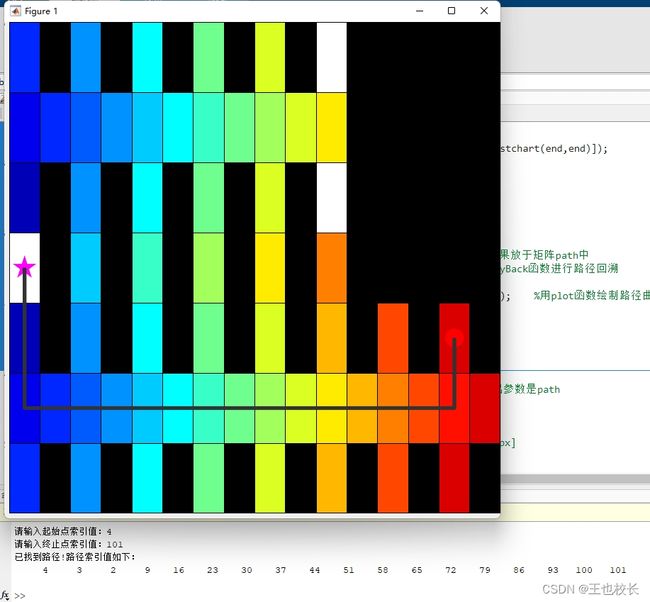
说明:输出的路径索引值中包含了起始点和终止点。
改进后完整代码如下:
close all;
clc,clear;    %清除命令窗口的内容

start_index = input("请输入起始点索引值:");
startposind = start_index;

goal_index = input("请输入终止点索引值:");
goalposind = goal_index;

field = readmatrix('map.xlsx');
[n, m] = size(field);

%方格以及障碍物的创建
[field_fli, costchart, fieldpointers] = initializeField(n, m, startposind, goalposind, field);

%路径规划中用到的一些矩阵的初始化
setOpen = startposind;    %用于存放待选点
setOpenCosts = 0;         %存放待选点到起始点的代价
setOpenHeuristics = Inf;  %存放待选点到终点的距离
setClosed = [];           %用于存放下一个进行拓展的父节点
setClosedCosts = [];      %存放拓展的父节点到终点的代价
movementdirections = {'R', 'L', 'D', 'U'};  %进行拓展的移动方向

%生成环境,障碍物,起点,终点
axishandle = createFigure(field_fli, costchart, startposind, goalposind);

%% 本程序的核心,利用循环进行迭代来寻找终止点
while ~max(ismember(setOpen, goalposind)) && ~isempty(setOpen)
    [temp, i] = min(setOpenCosts + setOpenHeuristics);     %temp是拓展出来的最小值,i是最小值在矩阵中的行数

    %把输入的点作为父节点,然后进行拓展找到子节点,并且找到子节点距离起始点和终点的代价
    [costs, heuristics, posinds] = findFValue(setOpen(i), setOpenCosts(i), field_fli, goalposind, 'euclidean');

    setClosed = [setClosed; setOpen(i)];     %将拓展出来的点中代价最小的那个点加到矩阵setClosed中
    setClosedCosts = [setClosedCosts; setOpenCosts(i)];    %将拓展出来的点中代价最小的那个点的代价加到矩阵setClosedCosts中

  %从setOpen中删除刚才放到矩阵setClosed中的那个点
  %如果这个点位于矩阵的内部
  if (i > 1 && i < length(setOpen))
    setOpen = [setOpen(1:i-1); setOpen(i+1:end)];
    setOpenCosts = [setOpenCosts(1:i-1); setOpenCosts(i+1:end)];
    setOpenHeuristics = [setOpenHeuristics(1:i-1); setOpenHeuristics(i+1:end)];

  %如果这个点位于矩阵第一行
  elseif (i == 1)
    setOpen = setOpen(2:end);
    setOpenCosts = setOpenCosts(2:end);
    setOpenHeuristics = setOpenHeuristics(2:end);

  %如果这个点位于矩阵的最后一行
  else
    setOpen = setOpen(1:end-1);
    setOpenCosts = setOpenCosts(1:end-1);
    setOpenHeuristics = setOpenHeuristics(1:end-1);
  end

  %把拓展出来的点中符合要求的点放到setOpen矩阵中,作为待选点
  for j = 1:length(posinds)
    if ~isinf(costs(j))   %该点(方格)不是障碍物

      %判断一下该点是否已经存在于setOpen矩阵或者setClosed矩阵中
      %如果我们要处理的拓展点既不在setOpen矩阵,也不在setClosed矩阵中
      if ~max([setClosed; setOpen] == posinds(j))
        fieldpointers(posinds(j)) = movementdirections(j);
        costchart(posinds(j)) = costs(j);
        setOpen = [setOpen; posinds(j)];
        setOpenCosts = [setOpenCosts; costs(j)];
        setOpenHeuristics = [setOpenHeuristics; heuristics(j)];

      %如果我们要处理的拓展点已经在setOpen矩阵中
      elseif max(setOpen == posinds(j))
        I = find(setOpen == posinds(j));
        %如果通过目前的方法找到的这个点,比之前的方法好(代价小)就更新这个点
        if setOpenCosts(I) > costs(j)
          costchart(setOpen(I)) = costs(j);
          setOpenCosts(I) = costs(j);
          setOpenHeuristics(I) = heuristics(j);
          fieldpointers(setOpen(I)) = movementdirections(j);
        end

      %如果我们要处理的拓展点已经在setClosed矩阵中
      else
        I = find(setClosed == posinds(j));
        %如果通过目前的方法找到的这个点,比之前的方法好(代价小)就更新这个点
        if setClosedCosts(I) > costs(j)
          costchart(setClosed(I)) = costs(j);
          setClosedCosts(I) = costs(j);
          fieldpointers(setClosed(I)) = movementdirections(j);
        end
      end
    end
  end

 if isempty(setOpen)
     break;
 end
  set(axishandle, 'CData', [costchart costchart(:,end); costchart(end,:) costchart(end,end)]);
  set(gca, 'CLim', [0 1.1*max(costchart(costchart < Inf))]);
  drawnow;
end

%调用findWayBack函数进行路径回溯,并绘制出路径曲线
if max(ismember(setOpen, goalposind))
  disp('已找到路径!路径索引值如下:');
  % path = findWayBack(goalposind, fieldpointers);  %进行路径回溯,将回溯结果放于矩阵path中
  [path, path_index] = findWayBack(goalposind, fieldpointers);  %调用findWayBack函数进行路径回溯
  disp(path_index(end:-1:1));   %打印输出路径的索引值
  plot(path(:,2)+0.5, path(:,1)+0.5, 'Color', 0.2*ones(3,1), 'LineWidth', 4);    %用plot函数绘制路径曲线
  drawnow;
elseif isempty(setOpen)
  disp('未找到路径!');
end

%% 进行路径回溯,输入参数是终止点goalposind和矩阵fieldpointers,输出参数是path,path_index
function [path, path_index] = findWayBack(goalposind, fieldpointers)
    [n, m] = size(fieldpointers);
    posind = goalposind;
    [py, px] = ind2sub([n, m], posind);   %将索引值posind转换为坐标值[py,px]
    path = [py px];
    path_index = posind;

    %利用while循环进行回溯,当我们回溯到起始点的时候停止,也就是在矩阵fieldpointers中找到S时停止
    while ~strcmp(fieldpointers{posind},'S')
      switch fieldpointers{posind}

        case 'L' % ’L’ 表示当前的点是由左边的点拓展出来的
          px = px - 1;
        case 'R' % ’R’ 表示当前的点是由右边的点拓展出来的
          px = px + 1;
        case 'U' % ’U’ 表示当前的点是由上面的点拓展出来的
          py = py - 1;
        case 'D' % ’D’ 表示当前的点是由下边的点拓展出来的
          py = py + 1;
      end
      path = [path; py px];
      posind = sub2ind([n m], py, px);  %将坐标值转换为索引值
      path_index = [path_index, posind];
    end
end


%%
%把输入的点作为父节点,然后进行拓展找到子节点,并且找到子节点距离起始点和终点的代价。
%costs表示拓展的子节点到起始点的代价,heuristics表示拓展出来的点到终止点的代价,posinds表示拓展出来的子节点
function [cost, heuristic, posinds] = findFValue(posind, costsofar, field, goalind, heuristicmethod)
    [n, m] = size(field);
    [currentpos(1), currentpos(2)] = ind2sub([n m], posind);   %将要进行拓展的点(也就是父节点)的索引值拓展成坐标值
    [goalpos(1), goalpos(2)] = ind2sub([n m], goalind);        %将终止点的索引值拓展成坐标值
    %将矩阵cost和heuristic初始化为4x1的无穷大值的矩阵,pos初始化为4x2的值为1的矩阵
    cost = Inf*ones(4,1);
    heuristic = Inf*ones(4,1);
    pos = ones(4,2);

    %拓展方向一
    newx = currentpos(2) - 1; newy = currentpos(1);
    if newx > 0
      pos(1,:) = [newy newx];
      switch lower(heuristicmethod)
        case 'euclidean'
          heuristic(1) = ((goalpos(2) - newx)^2 + (goalpos(1) - newy)^2)^0.5;  %计算终止点距离拓展点的代价或者说是距离
        case 'taxicab'
          heuristic(1) = ((goalpos(2) - newx)^2 + (goalpos(1) - newy)^2)^0.5;
      end
      cost(1) = costsofar + field(newy,newx);   %就是计算出拓展出来的点距离起始点的代价或者说距离
    end

    %拓展方向二
    newx = currentpos(2) + 1; newy = currentpos(1);
    if newx <= m
      pos(2,:) = [newy newx];
      switch lower(heuristicmethod)
        case 'euclidean'
          heuristic(2) = ((goalpos(2) - newx)^2 + (goalpos(1) - newy)^2)^0.5;
        case 'taxicab'
          heuristic(2) = ((goalpos(2) - newx)^2 + (goalpos(1) - newy)^2)^0.5;
      end
      cost(2) = costsofar + field(newy, newx);
    end

    %拓展方向三
    newx = currentpos(2); newy = currentpos(1) - 1;
    if newy > 0
      pos(3,:) = [newy newx];
      switch lower(heuristicmethod)
        case 'euclidean'
          heuristic(3) = ((goalpos(2) - newx)^2 + (goalpos(1) - newy)^2)^0.5;
        case 'taxicab'
          heuristic(3) = ((goalpos(2) - newx)^2 + (goalpos(1) - newy)^2)^0.5;
      end
      cost(3) = costsofar + field(newy, newx);
    end

    %拓展方向四
    newx = currentpos(2); newy = currentpos(1) + 1;
    if newy <= n
      pos(4,:) = [newy newx];
      switch lower(heuristicmethod)
        case 'euclidean'
          heuristic(4) = ((goalpos(2) - newx)^2 + (goalpos(1) - newy)^2)^0.5;
        case 'taxicab'
          heuristic(4) = ((goalpos(2) - newx)^2 + (goalpos(1) - newy)^2)^0.5;
      end
      cost(4) = costsofar + field(newy, newx);
    end
     posinds = sub2ind([n m], pos(:,1), pos(:,2));   %将拓展出来的子节点的坐标值转换为索引值
end


%%
%就是生成环境,障碍物,起始点,终止点等
function [field_fli, costchart, fieldpointers] = initializeField(n, m, startposind, goalposind, field)
   field_fli = flipud(field);   %实现矩阵的上下翻转
   [row, col] = find(field_fli == 1);
   field_fli(sub2ind([n m], row, col)) = Inf;
   [row, col] = find(field_fli == 0);
   field_fli(sub2ind([n m], row, col)) = 1;   %经过方格的代价或者说本身的代价
   [row, col] = find(field_fli == 2);
   field_fli(sub2ind([n m], row, col)) = 2;
   [row, col] = find(field_fli == 8);
   field_fli(sub2ind([n m], row, col)) = 8;
   %生成一个nxm的矩阵costchart,每个元素都设为NaN,就是矩阵初始NaN无效数据
   costchart = NaN*ones(n, m);

   %生成元胞数组
   fieldpointers = cell(n, m);        %生成元胞数组n*m
   fieldpointers{startposind} = 'S';  %将元胞数组的起始点处设为'S'
   fieldpointers{goalposind} = 'G';   %将元胞数组的终止点处设为'G'
   fieldpointers(field_fli == inf) = {0};
end


%%
%环境地图建模
function axishandle = createFigure(field, costchart, startposind, goalposind)
      if isempty(gcbf)
         figure('Position', [450 50 700 700], 'MenuBar','none');
         axes('position', [0.01 0.01 0.99 0.99]);     %本视图窗口建立一个坐标系
      else
         gcf;   %返回当前图像对象的句柄值
         cla;   %从当前坐标区删除包含可见句柄的所有图形对象
      end

      [n, m] = size(field);

      field(field < Inf) = 0;   %将fieid矩阵中没有障碍物的位置处设为0
      pcolor(1:m+1, 1:n+1, [field field(:,end); field(end,:) field(end,end)]);  %多加了一个重复的(由m * n变为 m+1 * n+1 )

      cmap = flipud(colormap('jet'));  %生成的cmap是一个256X3的矩阵,每一行的3个值都为0-1之间数,分别代表颜色组成的rgb值
      cmap(1,:) = zeros(3,1); cmap(end,:) = ones(3,1);   %将矩阵cmap的第一行设为0 ,最后一行设为1
      colormap(flipud(cmap));   %进行颜色的倒转
      hold on;

      axishandle = pcolor(1:m+1, 1:n+1, [costchart costchart(:,end); costchart(end,:) costchart(end,end)]);  %将矩阵costchart进行拓展,插值着色后赋给axishandle

      [goalposy, goalposx] = ind2sub([n, m], goalposind);
      [startposy, startposx] = ind2sub([n, m], startposind);
      plot(goalposx + 0.5, goalposy + 0.5, '-or', 'MarkerSize', 10, 'LineWidth', 10);
      plot(startposx + 0.5, startposy + 0.5, 'p', 'Markersize', 10, 'LineWidth', 5, 'Markerfacecolor', 'r', 'MarkerEdgeColor', 'm');
end
做个简单的试验,结果如下:


